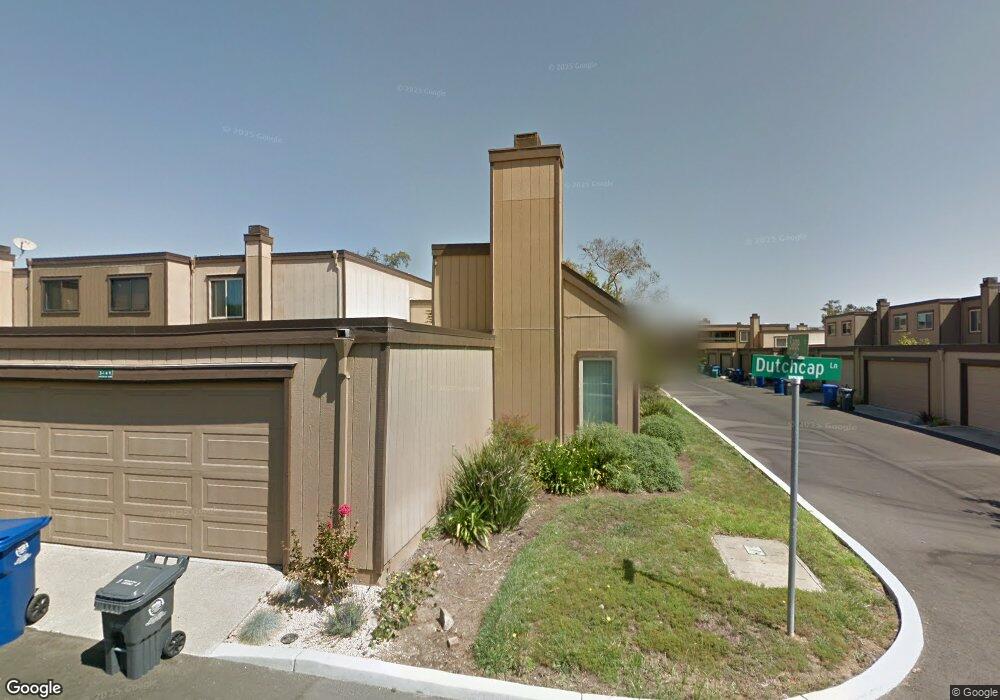
3449 Dutchcap Ln Alameda, CA 94502
Harbor Bay/Bay Farm NeighborhoodEstimated Value: $769,348 - $872,000
2
Beds
2
Baths
1,247
Sq Ft
$668/Sq Ft
Est. Value
About This Home
This home is located at 3449 Dutchcap Ln, Alameda, CA 94502 and is currently estimated at $833,587, approximately $668 per square foot. 3449 Dutchcap Ln is a home located in Alameda County with nearby schools including Amelia Earhart Elementary School, Lincoln Middle School, and Alameda High School.
Ownership History
Date
Name
Owned For
Owner Type
Purchase Details
Closed on
Feb 1, 2015
Sold by
Mull Teri E and The Teri E Mull Trust
Bought by
Raper Fern R
Current Estimated Value
Home Financials for this Owner
Home Financials are based on the most recent Mortgage that was taken out on this home.
Original Mortgage
$590,658
Interest Rate
3.75%
Mortgage Type
FHA
Purchase Details
Closed on
Feb 11, 2009
Sold by
Mull Gallardo Teri E and The Teri E Mull Revocable Trus
Bought by
Mull Teri E and Teri E Mull Trust
Purchase Details
Closed on
Apr 26, 2005
Sold by
Mull Teri E and Mull Gallardo Teri E
Bought by
Mull Gallardo Teri E and Teri E Mull Revocable Trust
Purchase Details
Closed on
Sep 17, 1998
Sold by
Murphy Stephen and The Exemption Trust Of The Joh
Bought by
Mull Teri E
Home Financials for this Owner
Home Financials are based on the most recent Mortgage that was taken out on this home.
Original Mortgage
$160,000
Interest Rate
6.88%
Purchase Details
Closed on
Mar 3, 1998
Sold by
Johns Evelyn N and Johns Stephen
Bought by
Johns Evelynn N and Murphy Stephen
Create a Home Valuation Report for This Property
The Home Valuation Report is an in-depth analysis detailing your home's value as well as a comparison with similar homes in the area
Home Values in the Area
Average Home Value in this Area
Purchase History
| Date | Buyer | Sale Price | Title Company |
|---|---|---|---|
| Raper Fern R | $605,000 | Placer Title Company | |
| Mull Teri E | -- | None Available | |
| Mull Gallardo Teri E | -- | -- | |
| Mull Teri E | $200,000 | Commonwealth Land Title Co | |
| Johns Evelynn N | -- | -- |
Source: Public Records
Mortgage History
| Date | Status | Borrower | Loan Amount |
|---|---|---|---|
| Previous Owner | Raper Fern R | $590,658 | |
| Previous Owner | Mull Teri E | $160,000 |
Source: Public Records
Tax History Compared to Growth
Tax History
| Year | Tax Paid | Tax Assessment Tax Assessment Total Assessment is a certain percentage of the fair market value that is determined by local assessors to be the total taxable value of land and additions on the property. | Land | Improvement |
|---|---|---|---|---|
| 2025 | $10,304 | $709,180 | $214,854 | $501,326 |
| 2024 | $10,304 | $695,138 | $210,641 | $491,497 |
| 2023 | $9,908 | $688,374 | $206,512 | $481,862 |
| 2022 | $9,684 | $667,877 | $202,463 | $472,414 |
| 2021 | $9,444 | $654,645 | $198,493 | $463,152 |
| 2020 | $9,331 | $654,863 | $196,459 | $458,404 |
| 2019 | $8,918 | $642,025 | $192,607 | $449,418 |
| 2018 | $8,692 | $629,441 | $188,832 | $440,609 |
| 2017 | $8,291 | $617,100 | $185,130 | $431,970 |
| 2016 | $8,301 | $605,000 | $181,500 | $423,500 |
| 2015 | $4,419 | $260,875 | $78,262 | $182,613 |
| 2014 | $4,246 | $255,765 | $76,729 | $179,036 |
Source: Public Records
Map
Nearby Homes
- 1083 Melrose Ave
- 1042 Jost Ln
- 3521 Oleander Ave
- 3525 Mcsherry Way
- 1042 Mangrove Ln
- 133 Mecartney Rd
- 3530 Depassier Way
- 127 Maitland Dr
- 3337 Solomon Ln
- 3344 Solomon Ln
- 3334 Solomon Ln
- 3315 Willis Ln
- 3308 Fir Ave
- 1117 Camino Del Valle
- 1160 Marianas Ln
- 3109 La Campania
- 1104 Verdemar Dr
- 327 Ratto Rd
- 510 Lagunaria Ln
- 3027 Alta Vista
- 3447 Dutchcap Ln
- 3445 Dutchcap Ln
- 3443 Dutchcap Ln
- 3441 Dutchcap Ln
- 1071 Melrose Ave
- 1069 Melrose Ave
- 1067 Melrose Ave
- 3448 Dutchcap Ln
- 3450 Dutchcap Ln
- 3439 Dutchcap Ln
- 3452 Dutchcap Ln
- 3446 Dutchcap Ln
- 1065 Melrose Ave
- 3454 Dutchcap Ln
- 3444 Dutchcap Ln
- 1063 Melrose Ave
- 3458 Dutchcap Ln
- 3437 Dutchcap Ln
- 1061 Melrose Ave
- 3462 Dutchcap Ln