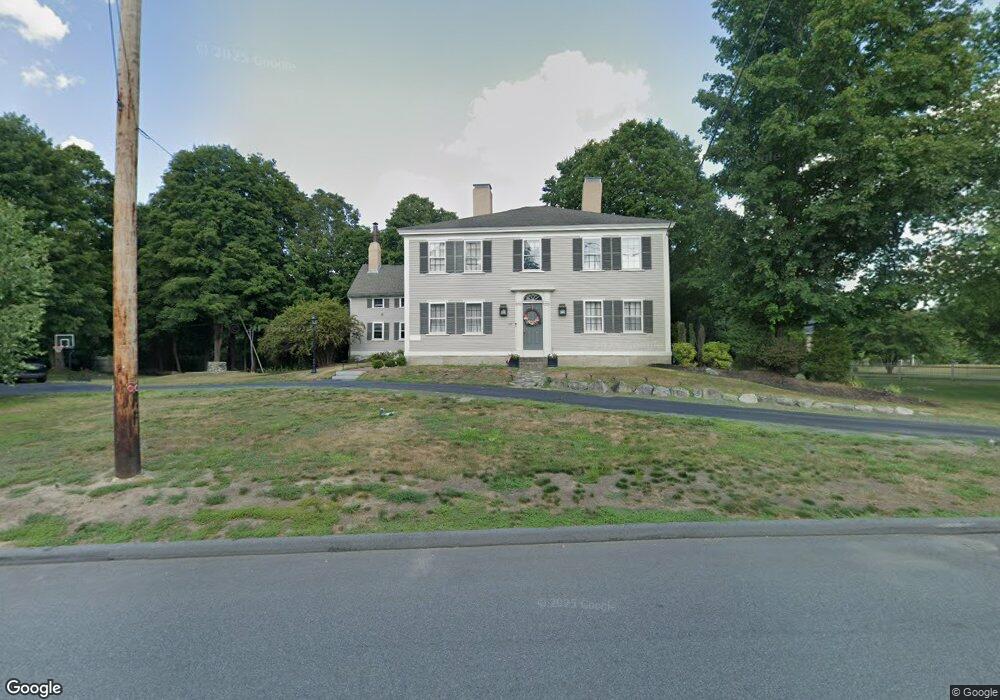
345 Chestnut St Unit 345 Lynnfield, MA 01940
Estimated Value: $1,466,000 - $1,707,000
5
Beds
3
Baths
4,323
Sq Ft
$363/Sq Ft
Est. Value
About This Home
This home is located at 345 Chestnut St Unit 345, Lynnfield, MA 01940 and is currently estimated at $1,569,792, approximately $363 per square foot. 345 Chestnut St Unit 345 is a home located in Essex County with nearby schools including Lynnfield Middle School, Pickering Middle School, and Lynnfield High School.
Ownership History
Date
Name
Owned For
Owner Type
Purchase Details
Closed on
Dec 15, 2021
Sold by
Greene Michelle P
Bought by
M P Greene T
Current Estimated Value
Purchase Details
Closed on
Jan 31, 2014
Sold by
Copelas Susan S
Bought by
Greene Michelle P
Home Financials for this Owner
Home Financials are based on the most recent Mortgage that was taken out on this home.
Original Mortgage
$250,000
Interest Rate
4.47%
Mortgage Type
New Conventional
Purchase Details
Closed on
Aug 25, 2008
Sold by
Copelas Peter A and Copelas Susan S
Bought by
Copelas Susan S
Purchase Details
Closed on
Jan 19, 1993
Sold by
Wilkinson Jo Ellen
Bought by
Copelas Peter A and Copelas Susan S
Create a Home Valuation Report for This Property
The Home Valuation Report is an in-depth analysis detailing your home's value as well as a comparison with similar homes in the area
Home Values in the Area
Average Home Value in this Area
Purchase History
| Date | Buyer | Sale Price | Title Company |
|---|---|---|---|
| M P Greene T | -- | None Available | |
| Greene Michelle P | $699,900 | -- | |
| Copelas Susan S | -- | -- | |
| Copelas Peter A | $380,000 | -- |
Source: Public Records
Mortgage History
| Date | Status | Borrower | Loan Amount |
|---|---|---|---|
| Previous Owner | Greene Michelle P | $250,000 | |
| Previous Owner | Copelas Peter A | $100,000 | |
| Previous Owner | Copelas Peter A | $150,000 |
Source: Public Records
Tax History Compared to Growth
Tax History
| Year | Tax Paid | Tax Assessment Tax Assessment Total Assessment is a certain percentage of the fair market value that is determined by local assessors to be the total taxable value of land and additions on the property. | Land | Improvement |
|---|---|---|---|---|
| 2025 | $13,397 | $1,268,700 | $650,600 | $618,100 |
| 2024 | $12,701 | $1,208,500 | $619,600 | $588,900 |
| 2023 | $13,315 | $1,178,300 | $619,600 | $558,700 |
| 2022 | $13,575 | $1,132,200 | $619,600 | $512,600 |
| 2021 | $11,594 | $873,700 | $513,400 | $360,300 |
| 2020 | $11,368 | $816,700 | $470,900 | $345,800 |
| 2019 | $10,769 | $774,200 | $428,400 | $345,800 |
| 2018 | $10,653 | $774,200 | $428,400 | $345,800 |
| 2017 | $10,668 | $774,200 | $428,400 | $345,800 |
| 2016 | $10,153 | $700,200 | $368,900 | $331,300 |
| 2015 | $10,782 | $744,100 | $368,900 | $375,200 |
Source: Public Records
Map
Nearby Homes
- 345 Chestnut St
- 2 Townsend Rd
- 344 Chestnut St
- 353 Chestnut St
- 340 Chestnut St
- 350 Chestnut St
- 1 Townsend Rd
- 4 Townsend Rd
- 4 Needham Rd
- 3 Townsend Rd
- 321 Chestnut St
- 324 Chestnut St
- 5 Townsend Rd
- 351 Chestnut St
- 3 Needham Rd
- 6 Townsend Rd
- 1 Charing Cross
- 409 Chestnut St
- 303 Chestnut St
- 370 Chestnut St