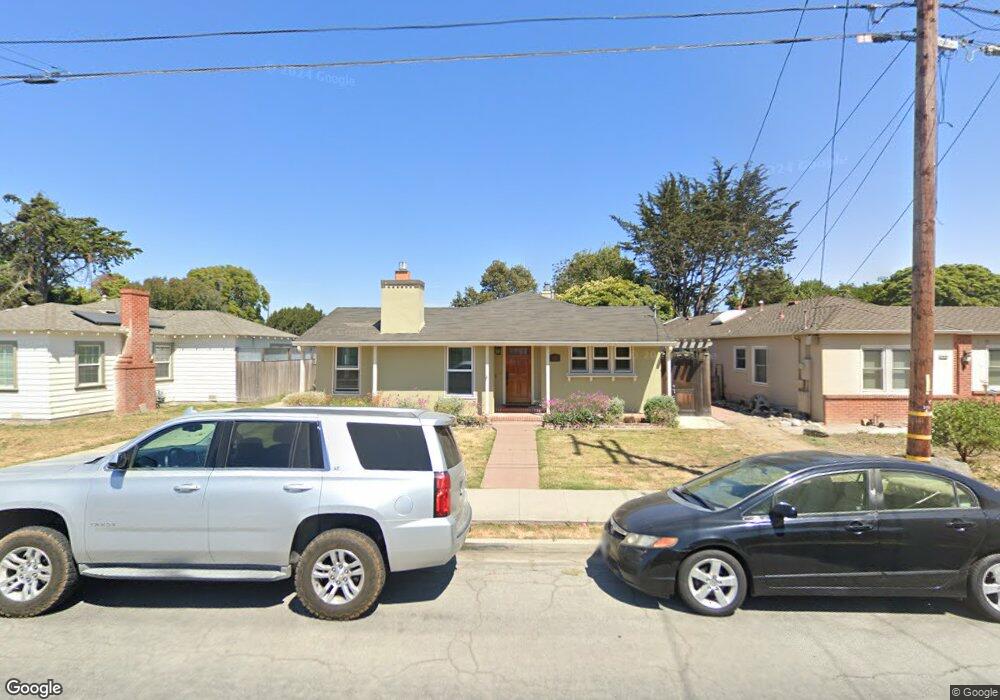
345 Lorimer St Salinas, CA 93901
South Salinas NeighborhoodEstimated Value: $646,000 - $800,000
2
Beds
1
Bath
1,200
Sq Ft
$591/Sq Ft
Est. Value
About This Home
This home is located at 345 Lorimer St, Salinas, CA 93901 and is currently estimated at $709,274, approximately $591 per square foot. 345 Lorimer St is a home located in Monterey County with nearby schools including Roosevelt Elementary School, Laurel Wood Elementary School, and Washington Middle School.
Ownership History
Date
Name
Owned For
Owner Type
Purchase Details
Closed on
Mar 2, 2021
Sold by
Hufford Gregory E and Hufford Paige E
Bought by
Hufford Gregory E and Hufford Paige E
Current Estimated Value
Home Financials for this Owner
Home Financials are based on the most recent Mortgage that was taken out on this home.
Original Mortgage
$313,846
Outstanding Balance
$281,341
Interest Rate
2.7%
Mortgage Type
New Conventional
Estimated Equity
$427,933
Purchase Details
Closed on
Jan 29, 2008
Sold by
Cornell Charlene G
Bought by
Hufford Greg E and Hufford Paige E
Home Financials for this Owner
Home Financials are based on the most recent Mortgage that was taken out on this home.
Original Mortgage
$387,000
Interest Rate
6.09%
Mortgage Type
Purchase Money Mortgage
Create a Home Valuation Report for This Property
The Home Valuation Report is an in-depth analysis detailing your home's value as well as a comparison with similar homes in the area
Home Values in the Area
Average Home Value in this Area
Purchase History
| Date | Buyer | Sale Price | Title Company |
|---|---|---|---|
| Hufford Gregory E | -- | Chicago Title Company | |
| Hufford Greg E | $430,000 | Old Republic Title Company |
Source: Public Records
Mortgage History
| Date | Status | Borrower | Loan Amount |
|---|---|---|---|
| Open | Hufford Gregory E | $313,846 | |
| Closed | Hufford Greg E | $387,000 |
Source: Public Records
Tax History
| Year | Tax Paid | Tax Assessment Tax Assessment Total Assessment is a certain percentage of the fair market value that is determined by local assessors to be the total taxable value of land and additions on the property. | Land | Improvement |
|---|---|---|---|---|
| 2025 | $6,385 | $564,820 | $367,791 | $197,029 |
| 2024 | $6,385 | $553,746 | $360,580 | $193,166 |
| 2023 | $6,169 | $542,889 | $353,510 | $189,379 |
| 2022 | $5,938 | $532,245 | $346,579 | $185,666 |
| 2021 | $5,702 | $521,810 | $339,784 | $182,026 |
| 2020 | $5,543 | $516,460 | $336,300 | $180,160 |
| 2019 | $4,964 | $457,000 | $298,000 | $159,000 |
| 2018 | $5,120 | $468,000 | $305,000 | $163,000 |
| 2017 | $4,517 | $405,000 | $264,000 | $141,000 |
| 2016 | $3,910 | $344,000 | $224,000 | $120,000 |
| 2015 | $3,874 | $333,000 | $217,000 | $116,000 |
| 2014 | $2,779 | $252,000 | $164,000 | $88,000 |
Source: Public Records
Map
Nearby Homes
- 330 Homestead Ave
- 805 Iverson St
- 606 Central Ave
- 612 Central Ave
- 730 Lemos Ave
- 23 Capitol St
- 22 Willow St
- 19 West St
- 220 Pajaro St
- 767 Lemos Ave
- 1051 Riker St Unit 7
- 710 Campus Ave
- 123 Chestnut St
- 813 Pajaro St
- 330 Woodside Dr Unit 105
- 116 Oak St
- 1052 Padre Dr Unit 3
- 138 Nissen Rd Unit 1
- 1051 Padre Dr Unit 7
- 1056 Padre Dr Unit 4
Your Personal Tour Guide
Ask me questions while you tour the home.