Estimated Value: $579,000 - $695,000
4
Beds
3
Baths
2,143
Sq Ft
$300/Sq Ft
Est. Value
About This Home
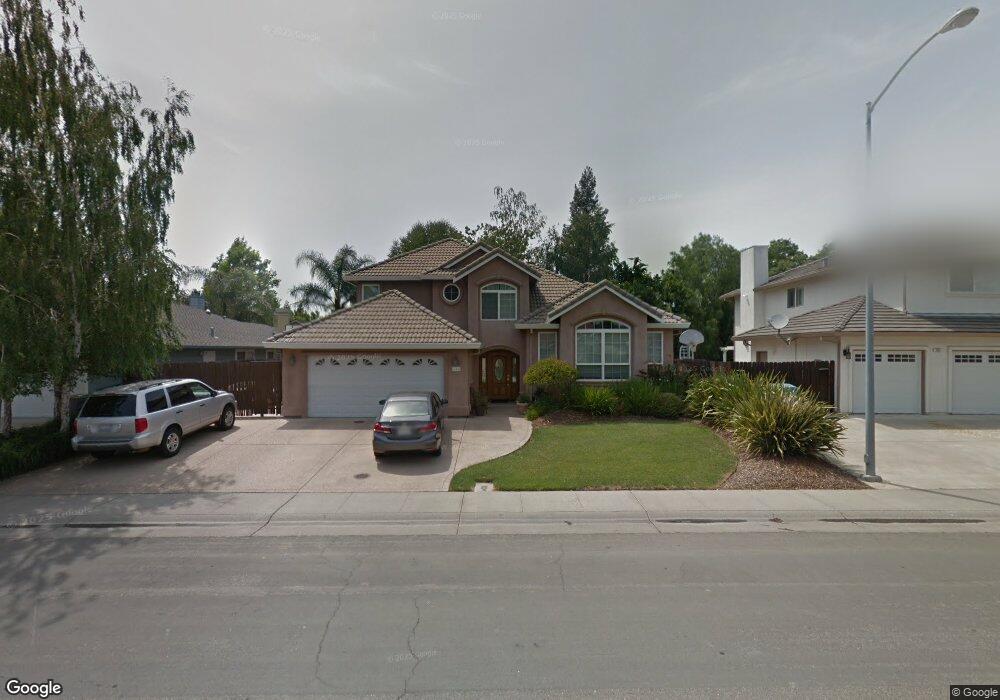
This home is located at 345 Lynd Way, Dixon, CA 95620 and is currently estimated at $643,950, approximately $300 per square foot. 345 Lynd Way is a home located in Solano County with nearby schools including Tremont Elementary School, Dixon High School, and Dixon Montessori Charter.
Ownership History
Date
Name
Owned For
Owner Type
Purchase Details
Closed on
Jul 14, 2021
Sold by
Carrasco Donna Kristine and Carrasco Joesph
Bought by
Carrasco Donna Kristine and Carrasco Joseph
Current Estimated Value
Home Financials for this Owner
Home Financials are based on the most recent Mortgage that was taken out on this home.
Original Mortgage
$242,600
Outstanding Balance
$185,615
Interest Rate
2.96%
Mortgage Type
New Conventional
Estimated Equity
$458,335
Purchase Details
Closed on
May 9, 2000
Sold by
Miller Donald M and Miller Juanita W
Bought by
Carrasco Joseph and Carrasco Donna K
Create a Home Valuation Report for This Property
The Home Valuation Report is an in-depth analysis detailing your home's value as well as a comparison with similar homes in the area
Home Values in the Area
Average Home Value in this Area
Purchase History
| Date | Buyer | Sale Price | Title Company |
|---|---|---|---|
| Carrasco Donna Kristine | -- | Old Republic Title Company | |
| Carrasco Joseph | $62,000 | Placer Title Company |
Source: Public Records
Mortgage History
| Date | Status | Borrower | Loan Amount |
|---|---|---|---|
| Open | Carrasco Donna Kristine | $242,600 |
Source: Public Records
Tax History Compared to Growth
Tax History
| Year | Tax Paid | Tax Assessment Tax Assessment Total Assessment is a certain percentage of the fair market value that is determined by local assessors to be the total taxable value of land and additions on the property. | Land | Improvement |
|---|---|---|---|---|
| 2025 | $4,357 | $383,937 | $100,351 | $283,586 |
| 2024 | $4,357 | $376,410 | $98,384 | $278,026 |
| 2023 | $4,228 | $369,030 | $96,455 | $272,575 |
| 2022 | $4,165 | $361,795 | $94,565 | $267,230 |
| 2021 | $4,112 | $354,702 | $92,711 | $261,991 |
| 2020 | $4,046 | $351,066 | $91,761 | $259,305 |
| 2019 | $3,969 | $344,183 | $89,962 | $254,221 |
| 2018 | $3,951 | $337,436 | $88,199 | $249,237 |
| 2017 | $3,852 | $330,820 | $86,470 | $244,350 |
| 2016 | $3,686 | $324,334 | $84,775 | $239,559 |
| 2015 | $3,602 | $319,463 | $83,502 | $235,961 |
| 2014 | $3,562 | $313,206 | $81,867 | $231,339 |
Source: Public Records
Map
Nearby Homes
- 1150 Mulberry Ln
- 1250 Redwood Ct
- 550 N Lincoln St
- 1251 Redwood Ct
- 1535 Eisenhower Ct
- 255 Alderglen Dr
- 1340 Snowberry Ct
- 1310 Hawthorne Ct
- 1349 Snowberry Ct
- 545 Pheasant Run Dr
- 540 Glenside Dr
- 741 W D St S
- 1615 Sequoia Way
- 700 W A St
- 920 N Lincoln St
- 1805 Derby Dr
- 2195 Prairie Way
- 635 Songbird Way
- 730 Daybreak Dr
- 650 Marvin Way