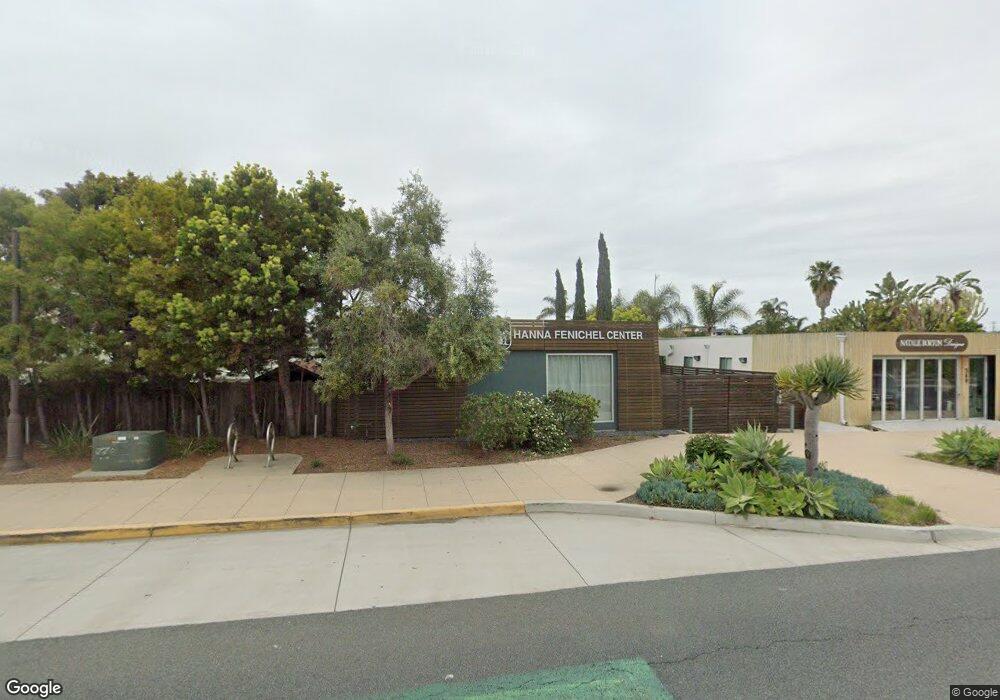
345 N Highway 101 Solana Beach, CA 92075
Estimated Value: $2,531,639
--
Bed
--
Bath
1,116
Sq Ft
$2,268/Sq Ft
Est. Value
About This Home
This home is located at 345 N Highway 101, Solana Beach, CA 92075 and is currently estimated at $2,531,639, approximately $2,268 per square foot. 345 N Highway 101 is a home located in San Diego County with nearby schools including Skyline Elementary School, Solana Vista Elementary School, and Earl Warren Middle School.
Ownership History
Date
Name
Owned For
Owner Type
Purchase Details
Closed on
Jul 21, 2020
Sold by
345 N 101 Llc
Bought by
Hanna Fenichel Center For Child Dev
Current Estimated Value
Home Financials for this Owner
Home Financials are based on the most recent Mortgage that was taken out on this home.
Original Mortgage
$1,600,000
Outstanding Balance
$1,418,774
Interest Rate
3.1%
Mortgage Type
Credit Line Revolving
Estimated Equity
$1,112,865
Purchase Details
Closed on
Feb 8, 2012
Sold by
Emery Szyndler Leanne M and Emery Leanne M
Bought by
345 N 101 Llc
Purchase Details
Closed on
Dec 13, 2011
Sold by
Deering C Greg
Bought by
Emery Leanne M
Purchase Details
Closed on
Aug 27, 2002
Sold by
Emery Thomas Parker
Bought by
Emery Thomas P
Create a Home Valuation Report for This Property
The Home Valuation Report is an in-depth analysis detailing your home's value as well as a comparison with similar homes in the area
Home Values in the Area
Average Home Value in this Area
Purchase History
| Date | Buyer | Sale Price | Title Company |
|---|---|---|---|
| Hanna Fenichel Center For Child Dev | $1,500,000 | Chicago Title Company | |
| 345 N 101 Llc | $685,000 | Fidelity National Title | |
| Emery Szyndler Leanne M | -- | Fidelity National Title | |
| Emery Leanne M | -- | None Available | |
| Emery Thomas P | -- | -- |
Source: Public Records
Mortgage History
| Date | Status | Borrower | Loan Amount |
|---|---|---|---|
| Open | Hanna Fenichel Center For Child Dev | $1,600,000 |
Source: Public Records
Tax History Compared to Growth
Tax History
| Year | Tax Paid | Tax Assessment Tax Assessment Total Assessment is a certain percentage of the fair market value that is determined by local assessors to be the total taxable value of land and additions on the property. | Land | Improvement |
|---|---|---|---|---|
| 2025 | $17,855 | $1,623,646 | $1,298,917 | $324,729 |
| 2024 | $17,855 | $1,591,811 | $1,273,449 | $318,362 |
| 2023 | $17,487 | $1,560,600 | $1,248,480 | $312,120 |
| 2022 | $17,226 | $1,530,000 | $1,224,000 | $306,000 |
| 2021 | $16,940 | $1,500,000 | $1,200,000 | $300,000 |
| 2020 | $9,350 | $786,718 | $689,099 | $97,619 |
| 2019 | $9,188 | $771,293 | $675,588 | $95,705 |
| 2018 | $9,013 | $756,171 | $662,342 | $93,829 |
| 2017 | $8,859 | $741,345 | $649,355 | $91,990 |
| 2016 | $8,389 | $726,810 | $636,623 | $90,187 |
| 2015 | $8,259 | $715,894 | $627,061 | $88,833 |
| 2014 | $8,091 | $701,871 | $614,778 | $87,093 |
Source: Public Records
Map
Nearby Homes
- 505 N Cedros Ave
- 422 Seabright Ln
- 148 N Acacia Ave
- 515 N Acacia Ave
- 241 E Cliff St
- 649 Seabright Ln
- 147 S Rios Ave
- 810 Seabright Ln
- 241 S Sierra Ave
- 308 Corto St
- 325 S Sierra Ave Unit 20
- 779 Barbara Ave
- 429 S Sierra Ave Unit 324
- 441 S Sierra Ave Unit 208
- 429 S Sierra Ave Unit 151
- 435 S Sierra Ave Unit 118
- 455 Glencrest Dr
- 515 S Sierra Ave Unit 124
- 521 S Rios Ave
- Plan 4 at Drift
- 349 N Highway 101
- 344 N Acacia Ave
- 344-46 N Acacia Ave
- 348 N Acacia Ave
- 339 N Highway 101
- 355 N Highway 101
- 0 N Acacia Ave
- 343 N Acacia Ave
- 347 N Acacia Ave
- 339 N Acacia Ave
- 351 N Acacia Ave
- N Acacia
- 333 N Acacia Ave
- 357 N Acacia Ave
- 327 N Acacia Ave
- 361 N Acacia Ave
- 336 N Sierra Ave
- 342 N Sierra Ave
- 332 N Sierra Ave
- 346 N Sierra Ave