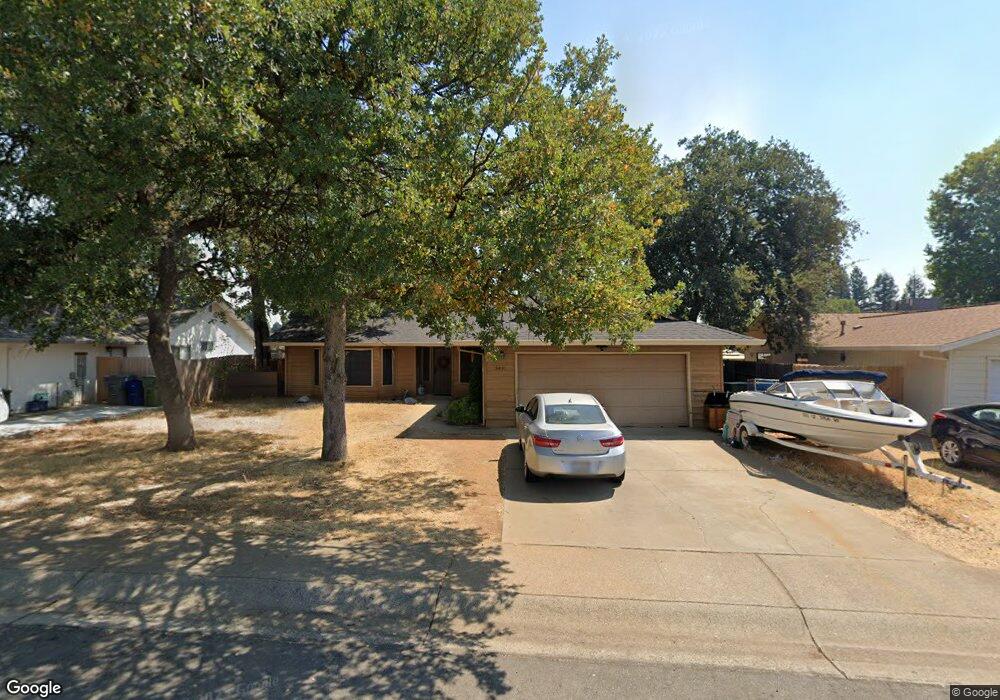
3451 Capricorn Way Redding, CA 96002
Starview NeighborhoodEstimated Value: $385,000 - $424,000
4
Beds
2
Baths
1,668
Sq Ft
$241/Sq Ft
Est. Value
About This Home
This home is located at 3451 Capricorn Way, Redding, CA 96002 and is currently estimated at $402,483, approximately $241 per square foot. 3451 Capricorn Way is a home located in Shasta County with nearby schools including Alta Mesa Elementary School, Parsons Junior High School, and Enterprise High School.
Ownership History
Date
Name
Owned For
Owner Type
Purchase Details
Closed on
Jan 26, 2023
Sold by
Robert And Sharie Holder Trust
Bought by
Sims Dillon
Current Estimated Value
Purchase Details
Closed on
Jan 3, 2012
Sold by
Sims Sharie L and Holder Sharie Louise
Bought by
Holder Robert and Holder Sharie Louise
Purchase Details
Closed on
Dec 20, 2001
Sold by
Sims Tobe R
Bought by
Sims Sharie L
Home Financials for this Owner
Home Financials are based on the most recent Mortgage that was taken out on this home.
Original Mortgage
$102,007
Interest Rate
6.84%
Mortgage Type
FHA
Purchase Details
Closed on
Dec 18, 2001
Sold by
Sanchez Evan Louis and Sanchez Caroline L
Bought by
Sims Sharie L and Anderson Carol H
Home Financials for this Owner
Home Financials are based on the most recent Mortgage that was taken out on this home.
Original Mortgage
$102,007
Interest Rate
6.84%
Mortgage Type
FHA
Create a Home Valuation Report for This Property
The Home Valuation Report is an in-depth analysis detailing your home's value as well as a comparison with similar homes in the area
Home Values in the Area
Average Home Value in this Area
Purchase History
| Date | Buyer | Sale Price | Title Company |
|---|---|---|---|
| Sims Dillon | -- | None Listed On Document | |
| Holder Robert | -- | None Available | |
| Sims Sharie L | -- | Fidelity National Title Co | |
| Sims Sharie L | $115,500 | Fidelity National Title Co |
Source: Public Records
Mortgage History
| Date | Status | Borrower | Loan Amount |
|---|---|---|---|
| Previous Owner | Sims Sharie L | $102,007 |
Source: Public Records
Tax History
| Year | Tax Paid | Tax Assessment Tax Assessment Total Assessment is a certain percentage of the fair market value that is determined by local assessors to be the total taxable value of land and additions on the property. | Land | Improvement |
|---|---|---|---|---|
| 2025 | $3,668 | $338,130 | $52,020 | $286,110 |
| 2024 | $2,746 | $331,500 | $51,000 | $280,500 |
| 2023 | $2,746 | $245,832 | $46,292 | $199,540 |
| 2022 | $2,089 | $187,909 | $41,751 | $146,158 |
| 2021 | $2,018 | $184,226 | $40,933 | $143,293 |
| 2020 | $2,009 | $182,338 | $40,514 | $141,824 |
| 2019 | $1,993 | $178,764 | $39,720 | $139,044 |
| 2018 | $1,970 | $175,260 | $38,942 | $136,318 |
| 2017 | $2,004 | $171,825 | $38,179 | $133,646 |
| 2016 | $1,875 | $168,457 | $37,431 | $131,026 |
| 2015 | $1,860 | $165,927 | $36,869 | $129,058 |
| 2014 | $1,847 | $162,677 | $36,147 | $126,530 |
Source: Public Records
Map
Nearby Homes
- 3512 Capricorn Way
- 2498 Saturn Skyway
- 0 Shasta View Unit 25-1945
- 2354 Suzette Ave
- 3688 Polaris Way
- 3733 Capricorn Way
- 3361 Alta Mesa Dr
- 2332 Venus Way
- 3183 Agassi Ln
- 2068 Solar Way
- 3792 Thomason Trail
- 3385 Wimbledon Dr
- 2427 Castlewood Dr
- 3685 Wimbledon Dr
- 3341 Timbercreek Dr
- 2115 Hawn Ave
- 2912 Squire Ave
- 3425 Silverwood St
- 2571 Erin Ln
- 3466 Silverwood St
- 3457 Capricorn Way
- 3439 Capricorn Way
- 3427 Capricorn Way
- 3475 Capricorn Way
- 3446 Capricorn Way
- 3432 Capricorn Way
- 3464 Capricorn Way
- 3415 Capricorn Way
- 3420 Capricorn Way
- 3483 Capricorn Way
- 3356 Forest Homes Dr Unit LOT50
- 3356 Forest Homes Dr
- 3478 Capricorn Way
- 3344 Forest Homes Dr
- 3368 Forest Homes Dr
- 3575 Leonard St
- 3409 Capricorn Way
- 3567 Leonard St
- 3517 Leonard St
- 3332 Forest Homes Dr Unit 3
Your Personal Tour Guide
Ask me questions while you tour the home.