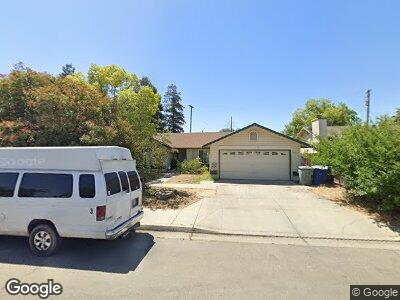
3453 W Weldon Ave Fresno, CA 93722
West Fresno NeighborhoodEstimated Value: $329,000 - $376,000
3
Beds
2
Baths
1,557
Sq Ft
$227/Sq Ft
Est. Value
About This Home
This home is located at 3453 W Weldon Ave, Fresno, CA 93722 and is currently estimated at $353,754, approximately $227 per square foot. 3453 W Weldon Ave is a home located in Fresno County with nearby schools including Hanh Phan Tilley Elementary, El Capitan Middle School, and Central East High School.
Ownership History
Date
Name
Owned For
Owner Type
Purchase Details
Closed on
Apr 29, 2010
Sold by
Federal National Mortgage Association
Bought by
Vang Ying and Vang Chong
Current Estimated Value
Home Financials for this Owner
Home Financials are based on the most recent Mortgage that was taken out on this home.
Original Mortgage
$131,400
Outstanding Balance
$89,852
Interest Rate
4.92%
Mortgage Type
New Conventional
Estimated Equity
$267,701
Purchase Details
Closed on
Feb 12, 2010
Sold by
Singh Parmjit and Singh Jaspal
Bought by
Federal National Mortgage Association
Purchase Details
Closed on
Oct 21, 1993
Sold by
Thomas R Butler Inc
Bought by
Singh Parmjit and Singh Jaspal
Home Financials for this Owner
Home Financials are based on the most recent Mortgage that was taken out on this home.
Original Mortgage
$98,100
Interest Rate
8.56%
Create a Home Valuation Report for This Property
The Home Valuation Report is an in-depth analysis detailing your home's value as well as a comparison with similar homes in the area
Home Values in the Area
Average Home Value in this Area
Purchase History
| Date | Buyer | Sale Price | Title Company |
|---|---|---|---|
| Vang Ying | $146,000 | Lawyers Title Company | |
| Federal National Mortgage Association | $260,725 | Accommodation | |
| Singh Parmjit | $103,500 | Central Title Company |
Source: Public Records
Mortgage History
| Date | Status | Borrower | Loan Amount |
|---|---|---|---|
| Open | Vang Ying | $131,400 | |
| Previous Owner | Singh Parmjit | $40,000 | |
| Previous Owner | Singh Parmjit | $244,000 | |
| Previous Owner | Singh Parmjit | $154,000 | |
| Previous Owner | Singh Parmjit | $140,000 | |
| Previous Owner | Singh Parmjit | $98,100 |
Source: Public Records
Tax History Compared to Growth
Tax History
| Year | Tax Paid | Tax Assessment Tax Assessment Total Assessment is a certain percentage of the fair market value that is determined by local assessors to be the total taxable value of land and additions on the property. | Land | Improvement |
|---|---|---|---|---|
| 2023 | $2,260 | $181,133 | $45,902 | $135,231 |
| 2022 | $2,132 | $177,582 | $45,002 | $132,580 |
| 2021 | $2,146 | $174,101 | $44,120 | $129,981 |
| 2020 | $2,041 | $172,317 | $43,668 | $128,649 |
| 2019 | $2,009 | $168,939 | $42,812 | $126,127 |
| 2018 | $1,962 | $165,627 | $41,973 | $123,654 |
| 2017 | $1,967 | $162,380 | $41,150 | $121,230 |
| 2016 | $1,813 | $159,197 | $40,344 | $118,853 |
| 2015 | $1,804 | $156,806 | $39,738 | $117,068 |
| 2014 | $1,802 | $153,735 | $38,960 | $114,775 |
Source: Public Records
Map
Nearby Homes
- 3561 W Weldon Ave
- 2409 N Valentine Ave
- 3256 W Clinton Ave
- 2194 N Feland Ave
- 3622 W Terrace Ave
- 3154 W Mckinley Ave
- 3185 W Mckinley Ave
- 2287 N Vernal Ave
- 3109 W Mckinley Ave Unit 29
- 2673 N Marty Ave
- 2347 N Sonora Ave
- 2736 N Selland Ave
- 2413 N Sonora Ave
- 2765 N Dewey Ave
- 1512 N Brawley Ave
- 3425 W Forrest Dr
- 2533 W Mckinley Ave Unit 232
- 2533 W Mckinley Ave Unit 290
- 2533 W Mckinley Ave Unit 51
- 3575 W Cortland Ave
- 3453 W Weldon Ave
- 3443 W Weldon Ave
- 3463 W Weldon Ave
- 3433 W Weldon Ave
- 3473 W Weldon Ave
- 3454 W Weldon Ave
- 3464 W Weldon Ave
- 2187 N Valentine Ave
- 3444 W Weldon Ave
- 3423 W Weldon Ave
- 3483 W Weldon Ave
- 3434 W Weldon Ave
- 3474 W Weldon Ave
- 3424 W Weldon Ave
- 3413 W Weldon Ave
- 3455 W Cambridge Ave
- 3445 W Cambridge Ave
- 3465 W Cambridge Ave
- 2219 N Rafael Ave
- 3435 W Cambridge Ave