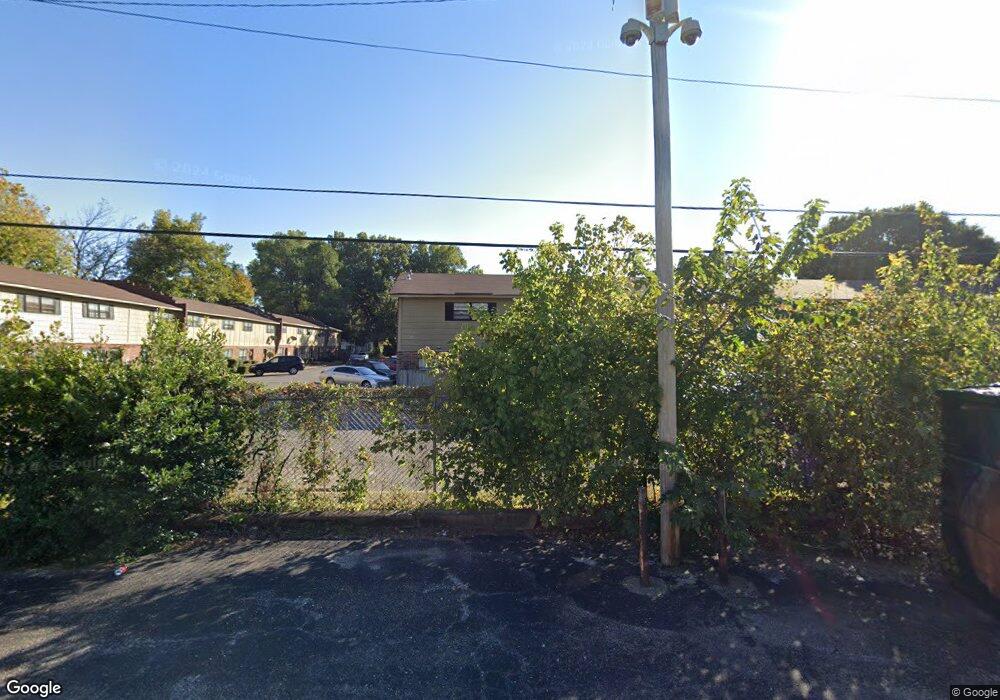
3455 Pruett Ct Memphis, TN 38111
Audubon Park NeighborhoodEstimated Value: $94,000 - $154,000
2
Beds
1
Bath
1,050
Sq Ft
$118/Sq Ft
Est. Value
About This Home
$500 MOVE IN SPECIAL!!!!!!! CALL TODAY!!!!
Fantastic 2-story townhouses are each 1,050 square feet with 2 bedrooms and 1.5 bathrooms. New Management is adding many upgrades including some kitchen remodeling, new tile and/or vinyl floors, new carpet, 24 hour/day video surveillance, controlled access entrance, and much more! Enjoy your private patio and a beautiful courtyard with lots of community green space. Less than a block to C.W Davis Park. Located less than a mile from the University of Memphis and only a few blocks to the Highland Strip.
Create a Home Valuation Report for This Property
The Home Valuation Report is an in-depth analysis detailing your home's value as well as a comparison with similar homes in the area
Home Values in the Area
Average Home Value in this Area
Property History
| Date | Event | Price | List to Sale | Price per Sq Ft |
|---|---|---|---|---|
| 07/04/2025 07/04/25 | Off Market | $1,295 | -- | -- |
| 08/07/2023 08/07/23 | For Rent | $1,295 | 0.0% | -- |
| 07/08/2023 07/08/23 | Price Changed | $1,295 | +29.5% | $1 / Sq Ft |
| 06/21/2023 06/21/23 | Price Changed | $1,000 | 0.0% | $1 / Sq Ft |
| 06/21/2023 06/21/23 | For Rent | $1,000 | +11.1% | -- |
| 06/14/2023 06/14/23 | For Rent | $900 | 0.0% | -- |
| 03/08/2023 03/08/23 | Price Changed | $900 | -10.0% | $1 / Sq Ft |
| 02/13/2023 02/13/23 | Price Changed | $1,000 | -4.8% | $1 / Sq Ft |
| 01/12/2023 01/12/23 | Price Changed | $1,050 | +5.0% | $1 / Sq Ft |
| 01/10/2023 01/10/23 | Price Changed | $1,000 | -9.1% | $1 / Sq Ft |
| 12/12/2022 12/12/22 | Price Changed | $1,100 | -4.3% | $1 / Sq Ft |
| 12/05/2022 12/05/22 | Price Changed | $1,150 | +9.5% | $1 / Sq Ft |
| 12/05/2022 12/05/22 | Price Changed | $1,050 | -4.5% | $1 / Sq Ft |
| 10/24/2022 10/24/22 | Price Changed | $1,100 | +15.8% | $1 / Sq Ft |
| 10/21/2022 10/21/22 | Price Changed | $950 | -13.6% | $1 / Sq Ft |
| 10/19/2022 10/19/22 | Price Changed | $1,100 | +10.0% | $1 / Sq Ft |
| 07/19/2022 07/19/22 | Price Changed | $1,000 | +2.6% | $1 / Sq Ft |
| 06/07/2022 06/07/22 | Price Changed | $975 | 0.0% | $1 / Sq Ft |
| 06/07/2022 06/07/22 | For Rent | $975 | +2.6% | -- |
| 05/18/2022 05/18/22 | For Rent | $950 | -- | -- |
Tax History Compared to Growth
Tax History
| Year | Tax Paid | Tax Assessment Tax Assessment Total Assessment is a certain percentage of the fair market value that is determined by local assessors to be the total taxable value of land and additions on the property. | Land | Improvement |
|---|---|---|---|---|
| 2025 | -- | $24,320 | $1,480 | $22,840 |
| 2024 | $170 | $5,000 | $925 | $4,075 |
| 2023 | $305 | $5,000 | $925 | $4,075 |
| 2022 | $305 | $5,000 | $925 | $4,075 |
| 2021 | $308 | $5,000 | $925 | $4,075 |
| 2020 | $326 | $4,500 | $925 | $3,575 |
| 2019 | $326 | $4,500 | $925 | $3,575 |
| 2018 | $326 | $4,500 | $925 | $3,575 |
| 2017 | $185 | $4,500 | $925 | $3,575 |
| 2016 | $236 | $5,400 | $0 | $0 |
| 2014 | $236 | $5,400 | $0 | $0 |
Source: Public Records
Map
Nearby Homes
- 3465 Spottswood Ave
- 3397 Southern Ave
- 3547 Spottswood Ave
- 648 Lagrange Park Cove
- 669 Lagrange Park Cove
- 520 Ellsworth St
- 3579 Kearney Ave
- 3298 Spottswood Ave
- 505 S Prescott St
- 3610 Kearney Ave
- 586 S Holmes St
- 3636 Spottswood Ave Unit 1
- 3646 Spottswood Ave Unit 10
- 3244 Spottswood Ave
- 3549 Marion Ave
- 440 Ellsworth St
- 580 S Greer St
- 491 Alexander St
- 3654 Douglass Ave
- 546 S Greer St
- 3455 Pruett Ct
- 3455 Pruett Ct Unit 3455
- 3457 Pruett Ct Unit 3457
- 3451 Pruett Ct
- 3449 Pruett Ct Unit 3440
- 3453 Pruett Ct
- 3447 Pruett Ct
- 3450 Pruett Ct
- 3452 Pruett Ct
- 3448 Pruett Ct
- 3454 Pruett Ct
- 3445 Pruett Ct
- 3446 Pruett Ct
- 3443 Pruett Ct
- 3444 Pruett Ct
- 3441 Pruett Ct Unit 3441
- 3442 Pruett Ct Unit 3442
- 686 Hobbs Dr Unit 676
- 686 Hobbs Dr Unit 686
- 688 Hobbs Dr