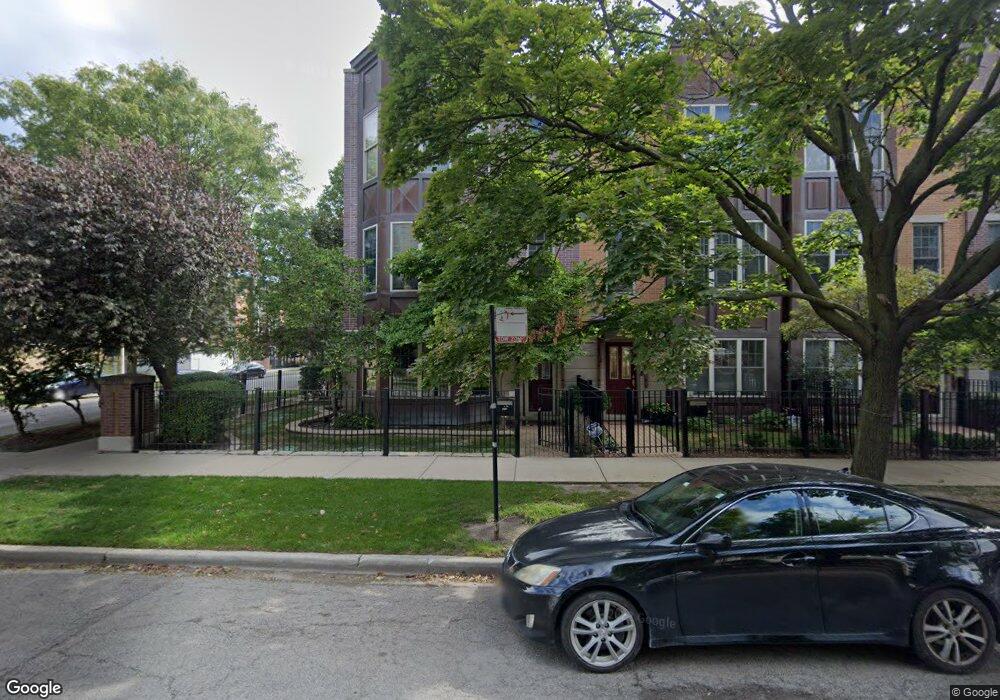
3459 N Whipple St Unit 3459 Chicago, IL 60618
Avondale NeighborhoodEstimated Value: $767,000 - $889,000
4
Beds
4
Baths
2,324
Sq Ft
$349/Sq Ft
Est. Value
About This Home
This home is located at 3459 N Whipple St Unit 3459, Chicago, IL 60618 and is currently estimated at $810,135, approximately $348 per square foot. 3459 N Whipple St Unit 3459 is a home located in Cook County with nearby schools including Linne Elementary School, Schurz High School, and Acero Charter - Carlos Fuentes Cmpus.
Ownership History
Date
Name
Owned For
Owner Type
Purchase Details
Closed on
Dec 19, 2016
Sold by
Clausen Torsten and Sullivan Lisa C
Bought by
Ramos Oscar
Current Estimated Value
Home Financials for this Owner
Home Financials are based on the most recent Mortgage that was taken out on this home.
Original Mortgage
$422,400
Outstanding Balance
$344,714
Interest Rate
3.87%
Mortgage Type
New Conventional
Estimated Equity
$465,421
Purchase Details
Closed on
Jun 28, 2007
Sold by
Sullivan Lisa C
Bought by
Clausen Torsten and Sullivan Lisa C
Home Financials for this Owner
Home Financials are based on the most recent Mortgage that was taken out on this home.
Original Mortgage
$417,000
Interest Rate
6.54%
Mortgage Type
Construction
Purchase Details
Closed on
Jun 20, 2007
Sold by
Albany Bank & Trust Co Na
Bought by
Sullivan Lisa
Home Financials for this Owner
Home Financials are based on the most recent Mortgage that was taken out on this home.
Original Mortgage
$417,000
Interest Rate
6.54%
Mortgage Type
Construction
Create a Home Valuation Report for This Property
The Home Valuation Report is an in-depth analysis detailing your home's value as well as a comparison with similar homes in the area
Home Values in the Area
Average Home Value in this Area
Purchase History
| Date | Buyer | Sale Price | Title Company |
|---|---|---|---|
| Ramos Oscar | $528,000 | Stewart Title | |
| Clausen Torsten | -- | Freedom Title Corp | |
| Sullivan Lisa | $575,000 | Freedom Title Corp |
Source: Public Records
Mortgage History
| Date | Status | Borrower | Loan Amount |
|---|---|---|---|
| Open | Ramos Oscar | $422,400 | |
| Previous Owner | Clausen Torsten | $417,000 | |
| Previous Owner | Sullivan Lisa | $43,725 |
Source: Public Records
Tax History Compared to Growth
Tax History
| Year | Tax Paid | Tax Assessment Tax Assessment Total Assessment is a certain percentage of the fair market value that is determined by local assessors to be the total taxable value of land and additions on the property. | Land | Improvement |
|---|---|---|---|---|
| 2024 | $11,858 | $65,999 | $11,135 | $54,864 |
| 2023 | $11,558 | $56,000 | $8,980 | $47,020 |
| 2022 | $11,558 | $56,000 | $8,980 | $47,020 |
| 2021 | $11,298 | $56,001 | $8,981 | $47,020 |
| 2020 | $10,981 | $49,114 | $3,951 | $45,163 |
| 2019 | $11,004 | $54,572 | $3,951 | $50,621 |
| 2018 | $10,780 | $54,572 | $3,951 | $50,621 |
| 2017 | $10,777 | $50,062 | $3,592 | $46,470 |
| 2016 | $9,527 | $50,062 | $3,592 | $46,470 |
| 2015 | $8,693 | $50,062 | $3,592 | $46,470 |
| 2014 | $6,893 | $39,719 | $3,232 | $36,487 |
| 2013 | $6,746 | $39,719 | $3,232 | $36,487 |
Source: Public Records
Map
Nearby Homes
- 3523 N Whipple St
- 3100 N Albany Ave
- 3342 N Whipple St
- 3621 N Richmond St
- 2844 W Addison St Unit P1
- 3634 N Mozart St
- 3234 N Albany Ave
- 3716 N Richmond St
- 3314 N California Ave
- 3312 N California Ave
- 3748 N Sacramento Ave
- 3122 W Belmont Ave
- 3215 N Francisco Ave Unit 3S
- 3035 W Belmont Ave Unit 3E
- 3748 N Troy St
- 3801 N Albany Ave
- 3209 N Elston Ave Unit 2S
- 3801 N Kedzie Ave Unit 1S
- 3718 N Spaulding Ave
- 3815 N Kedzie Ave Unit 3S
- 3455 N Whipple St
- 3453 N Whipple St
- 3021 W Cornelia Ave Unit 1
- 3451 N Whipple St
- 3019 W Cornelia Ave Unit 8
- 3449 N Whipple St
- 3449 N Whipple St Unit 15
- 3014 W Newport Ave
- 3501 N Whipple St
- 3501 N Whipple St Unit 2
- 3501 N Whipple St
- 3016 W Newport Ave
- 3015 W Cornelia Ave
- 3018 W Newport Ave
- 3505 N Whipple St Unit 1
- 3505 N Whipple St
- 3020 W Newport Ave
- 3460 N Whipple St
- 3009 W Cornelia Ave