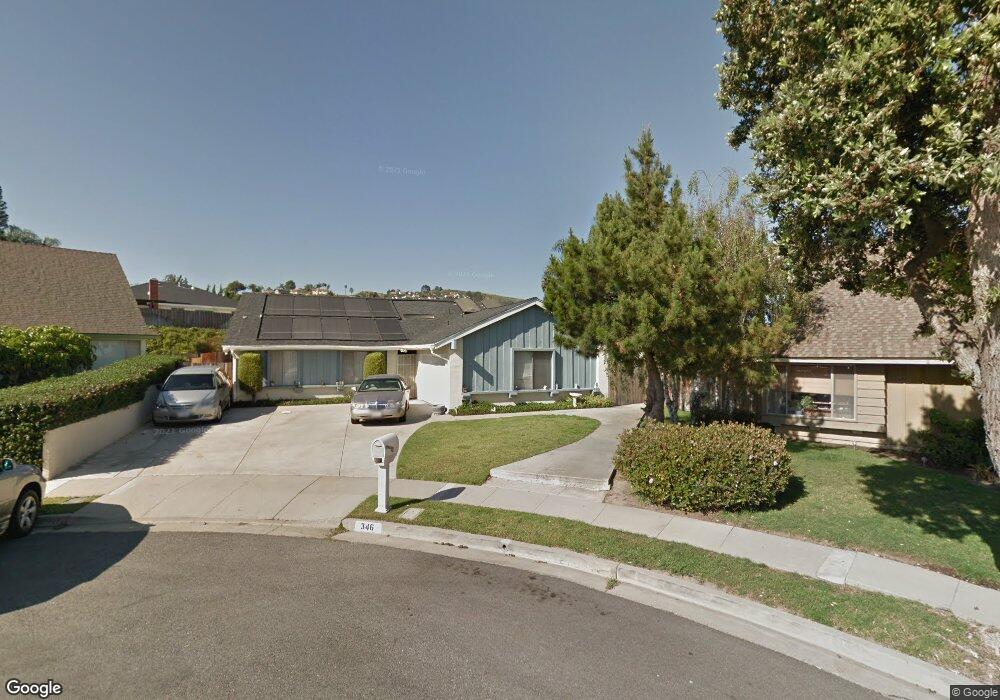
346 Villanova Ave Ventura, CA 93003
College NeighborhoodEstimated Value: $1,155,120 - $1,387,000
4
Beds
3
Baths
1,842
Sq Ft
$695/Sq Ft
Est. Value
About This Home
This home is located at 346 Villanova Ave, Ventura, CA 93003 and is currently estimated at $1,280,030, approximately $694 per square foot. 346 Villanova Ave is a home located in Ventura County with nearby schools including Poinsettia Elementary School, Anacapa Middle School, and Buena High School.
Ownership History
Date
Name
Owned For
Owner Type
Purchase Details
Closed on
Dec 11, 2019
Sold by
Spann William D and Spann Timothy G
Bought by
Spann William D
Current Estimated Value
Purchase Details
Closed on
Nov 3, 2011
Sold by
Spann Wanda M
Bought by
Spann Wanda M
Home Financials for this Owner
Home Financials are based on the most recent Mortgage that was taken out on this home.
Original Mortgage
$161,000
Outstanding Balance
$64,106
Interest Rate
4.06%
Mortgage Type
New Conventional
Estimated Equity
$1,215,924
Purchase Details
Closed on
Jan 16, 2007
Sold by
Spann Wanda M
Bought by
Spann Wanda M
Purchase Details
Closed on
Jun 4, 1997
Sold by
Spann William D and Spann Wanda M
Bought by
Spann William D and Spann Wanda M
Purchase Details
Closed on
Jan 6, 1994
Sold by
Spann William D and Spann Wanda M
Bought by
Spann William D and Spann Wanda M
Purchase Details
Closed on
Dec 30, 1993
Sold by
Spann William D and Spann Wanda M
Bought by
Spann William D and Spann Wanda M
Create a Home Valuation Report for This Property
The Home Valuation Report is an in-depth analysis detailing your home's value as well as a comparison with similar homes in the area
Home Values in the Area
Average Home Value in this Area
Purchase History
| Date | Buyer | Sale Price | Title Company |
|---|---|---|---|
| Spann William D | -- | None Available | |
| Spann Wanda M | -- | First American Title Company | |
| Spann Wanda M | -- | First American Title Company | |
| Spann Wanda M | -- | None Available | |
| Spann William D | -- | -- | |
| Spann William D | -- | First American Title Ins Co | |
| Spann William D | -- | First American Title Ins Co |
Source: Public Records
Mortgage History
| Date | Status | Borrower | Loan Amount |
|---|---|---|---|
| Open | Spann Wanda M | $161,000 |
Source: Public Records
Tax History Compared to Growth
Tax History
| Year | Tax Paid | Tax Assessment Tax Assessment Total Assessment is a certain percentage of the fair market value that is determined by local assessors to be the total taxable value of land and additions on the property. | Land | Improvement |
|---|---|---|---|---|
| 2025 | $3,957 | $369,045 | $124,698 | $244,347 |
| 2024 | $3,957 | $361,809 | $122,253 | $239,556 |
| 2023 | $3,911 | $354,715 | $119,856 | $234,859 |
| 2022 | $3,638 | $347,760 | $117,506 | $230,254 |
| 2021 | $3,647 | $340,942 | $115,202 | $225,740 |
| 2020 | $3,614 | $337,448 | $114,022 | $223,426 |
| 2019 | $3,477 | $330,833 | $111,787 | $219,046 |
| 2018 | $3,418 | $324,347 | $109,596 | $214,751 |
| 2017 | $3,355 | $317,989 | $107,448 | $210,541 |
| 2016 | $3,296 | $311,755 | $105,342 | $206,413 |
| 2015 | $3,243 | $307,073 | $103,760 | $203,313 |
| 2014 | $3,197 | $301,060 | $101,729 | $199,331 |
Source: Public Records
Map
Nearby Homes
- 412 Dayloma Ave
- 275 Fairfax Ave
- 288 Byron Ave
- 262 Crestwood Ave
- 4797 Loma Vista Rd
- 572 Skyline Rd
- 5633 Pembroke St
- 5438 Rainier St
- 6005 Sutter St
- 5365 Queens St
- 6174 Cobblestone Dr
- 6153 Cobblestone Dr
- 4205 Foothill Rd
- 159 Donner Ave
- 146 Donner Ave
- 6019 Cloverly St
- 322 S Victoria Ave
- 91 Mount Whitney Ct
- 4700 Aurora Dr Unit 16
- 4700 Aurora Dr Unit 75
- 363 Villanova Ave
- 365 Heidelberg Ave
- 328 Villanova Ave
- 347 Heidelberg Ave
- 5238 Beckford St
- 5254 Beckford St
- 329 Heidelberg Ave
- 5222 Beckford St
- 345 Villanova Ave
- 5260 Beckford St
- 310 Villanova Ave
- 5206 Beckford St
- 327 Villanova Ave
- 311 Heidelberg Ave
- 309 Villanova Ave
- 292 Villanova Ave
- 362 Heidelberg Ave
- 344 Heidelberg Ave
- 380 Heidelberg Ave
- 374 Day Rd