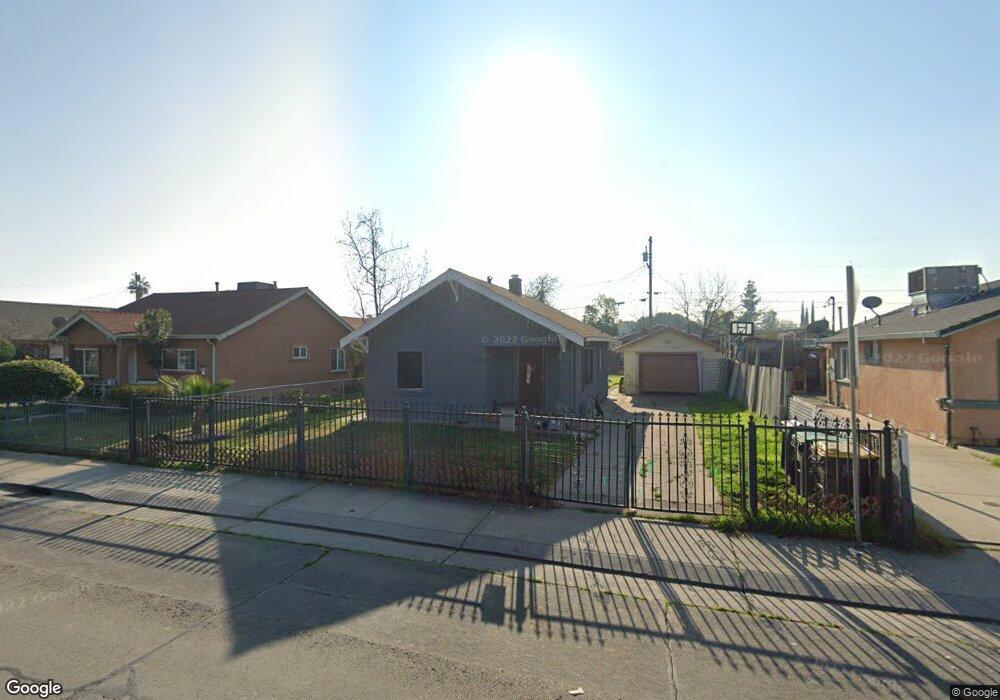
346 W 6th St Stockton, CA 95206
Seaport NeighborhoodEstimated Value: $209,000 - $274,994
2
Beds
1
Bath
672
Sq Ft
$357/Sq Ft
Est. Value
About This Home
This home is located at 346 W 6th St, Stockton, CA 95206 and is currently estimated at $239,999, approximately $357 per square foot. 346 W 6th St is a home located in San Joaquin County with nearby schools including Dolores Huerta Elementary School, McKinley Elementary School, and Hazelton Elementary School.
Ownership History
Date
Name
Owned For
Owner Type
Purchase Details
Closed on
Sep 23, 2020
Sold by
Rosiles Antonio
Bought by
Juarez Renee L
Current Estimated Value
Home Financials for this Owner
Home Financials are based on the most recent Mortgage that was taken out on this home.
Original Mortgage
$191,468
Outstanding Balance
$169,915
Interest Rate
2.9%
Mortgage Type
FHA
Estimated Equity
$70,084
Purchase Details
Closed on
Aug 19, 2009
Sold by
Sanchez Susan E
Bought by
Rosiles Antonio
Purchase Details
Closed on
Apr 26, 2005
Sold by
Sanchez Javier C
Bought by
Sanchez Susan E
Purchase Details
Closed on
Jan 27, 2000
Sold by
Sumalbag Felix and Sumalbag Alicia
Bought by
Sanchez Javier C and Sanchez Susan E
Home Financials for this Owner
Home Financials are based on the most recent Mortgage that was taken out on this home.
Original Mortgage
$37,600
Interest Rate
7.96%
Purchase Details
Closed on
May 8, 1995
Sold by
Ranchhod Harsha
Bought by
Ranchhod Ajay
Create a Home Valuation Report for This Property
The Home Valuation Report is an in-depth analysis detailing your home's value as well as a comparison with similar homes in the area
Home Values in the Area
Average Home Value in this Area
Purchase History
| Date | Buyer | Sale Price | Title Company |
|---|---|---|---|
| Juarez Renee L | $195,000 | Consumers Title Co Of Ca | |
| Rosiles Antonio | $40,000 | First American Title Company | |
| Sanchez Susan E | -- | -- | |
| Sanchez Javier C | $47,000 | Chicago Title Co | |
| Ranchhod Ajay | -- | North American Title Company |
Source: Public Records
Mortgage History
| Date | Status | Borrower | Loan Amount |
|---|---|---|---|
| Open | Juarez Renee L | $191,468 | |
| Previous Owner | Sanchez Javier C | $37,600 |
Source: Public Records
Tax History Compared to Growth
Tax History
| Year | Tax Paid | Tax Assessment Tax Assessment Total Assessment is a certain percentage of the fair market value that is determined by local assessors to be the total taxable value of land and additions on the property. | Land | Improvement |
|---|---|---|---|---|
| 2025 | $3,587 | $283,595 | $70,357 | $213,238 |
| 2024 | $3,529 | $278,035 | $68,978 | $209,057 |
| 2023 | $3,450 | $272,584 | $67,626 | $204,958 |
| 2022 | $3,695 | $267,240 | $66,300 | $200,940 |
| 2021 | $3,195 | $262,000 | $65,000 | $197,000 |
| 2020 | $616 | $47,207 | $11,801 | $35,406 |
| 2019 | $614 | $46,282 | $11,570 | $34,712 |
| 2018 | $602 | $45,376 | $11,344 | $34,032 |
| 2017 | $1,007 | $44,487 | $11,122 | $33,365 |
| 2016 | $581 | $43,615 | $10,904 | $32,711 |
| 2015 | $581 | $42,960 | $10,740 | $32,220 |
| 2014 | $555 | $42,119 | $10,530 | $31,589 |
Source: Public Records
Map
Nearby Homes
- 332 Kolher St
- 1932 S Lincoln St
- 314 Kolher St
- 426 Howard St
- 220 Delhi Ave
- 407 W 7th St
- 364 W 7th St
- 509 Howard St
- 2332 S Madison St
- 544 W 9th St
- 539 Buena Vida Ct
- 3504 French Camp Turnpike
- 231 E 5th St
- 864 W 5th St
- 1926 S San Joaquin St
- 2624 S Monroe St
- 1723 S Sutter St
- 1516 S Hunter St
- 1249 S Madison St
- 2723 S Van Buren St