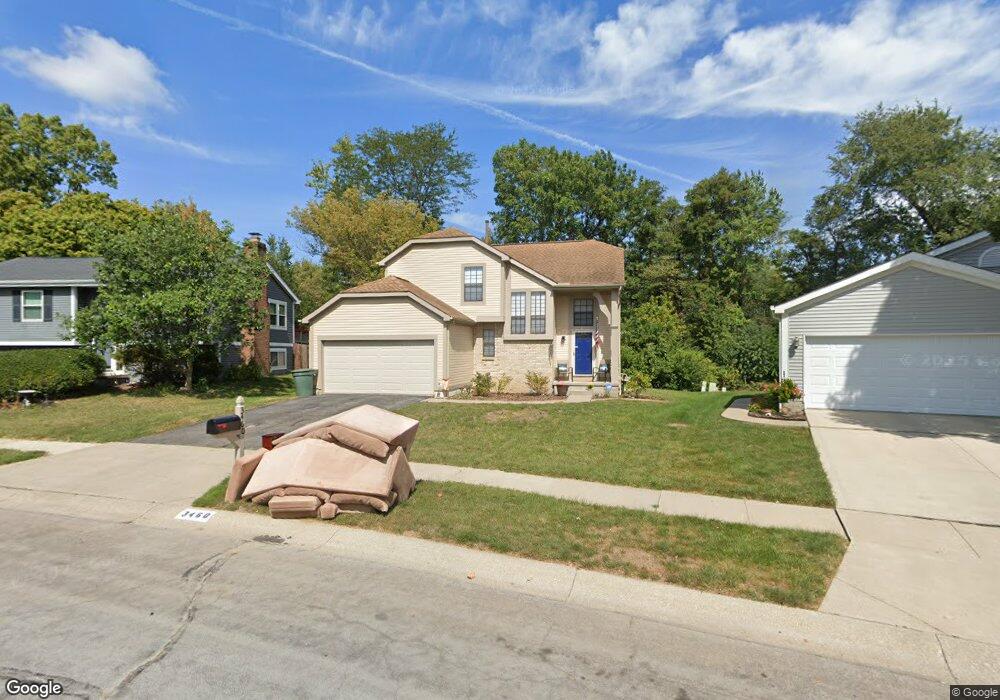
3460 Laurent Ct Columbus, OH 43231
Parkview NeighborhoodEstimated Value: $319,000 - $378,000
3
Beds
3
Baths
1,516
Sq Ft
$225/Sq Ft
Est. Value
About This Home
This home is located at 3460 Laurent Ct, Columbus, OH 43231 and is currently estimated at $340,629, approximately $224 per square foot. 3460 Laurent Ct is a home located in Franklin County with nearby schools including Hawthorne Elementary School, Heritage Middle School, and Westerville South High School.
Ownership History
Date
Name
Owned For
Owner Type
Purchase Details
Closed on
Apr 21, 2015
Sold by
Moriarity Stephanie A
Bought by
Moriarity Travis J
Current Estimated Value
Home Financials for this Owner
Home Financials are based on the most recent Mortgage that was taken out on this home.
Original Mortgage
$116,800
Outstanding Balance
$89,718
Interest Rate
3.68%
Mortgage Type
New Conventional
Estimated Equity
$250,911
Purchase Details
Closed on
Sep 27, 2001
Sold by
Lucas Scott A
Bought by
Moriarty Travis J and Moriarty Stephanie A
Home Financials for this Owner
Home Financials are based on the most recent Mortgage that was taken out on this home.
Original Mortgage
$134,934
Interest Rate
6.97%
Mortgage Type
FHA
Purchase Details
Closed on
Jul 28, 1988
Bought by
Lucas Scott A
Create a Home Valuation Report for This Property
The Home Valuation Report is an in-depth analysis detailing your home's value as well as a comparison with similar homes in the area
Home Values in the Area
Average Home Value in this Area
Purchase History
| Date | Buyer | Sale Price | Title Company |
|---|---|---|---|
| Moriarity Travis J | -- | Landsel Title | |
| Moriarty Travis J | $136,000 | Peterson Title Agency | |
| Lucas Scott A | $95,200 | -- |
Source: Public Records
Mortgage History
| Date | Status | Borrower | Loan Amount |
|---|---|---|---|
| Open | Moriarity Travis J | $116,800 | |
| Closed | Moriarty Travis J | $134,934 |
Source: Public Records
Tax History Compared to Growth
Tax History
| Year | Tax Paid | Tax Assessment Tax Assessment Total Assessment is a certain percentage of the fair market value that is determined by local assessors to be the total taxable value of land and additions on the property. | Land | Improvement |
|---|---|---|---|---|
| 2024 | $4,807 | $96,460 | $22,750 | $73,710 |
| 2023 | $4,691 | $96,460 | $22,750 | $73,710 |
| 2022 | $4,319 | $67,800 | $12,040 | $55,760 |
| 2021 | $4,362 | $67,800 | $12,040 | $55,760 |
| 2020 | $4,347 | $67,800 | $12,040 | $55,760 |
| 2019 | $3,644 | $54,220 | $9,630 | $44,590 |
| 2018 | $3,568 | $54,220 | $9,630 | $44,590 |
| 2017 | $3,654 | $54,220 | $9,630 | $44,590 |
| 2016 | $3,567 | $48,270 | $10,400 | $37,870 |
| 2015 | $3,575 | $48,270 | $10,400 | $37,870 |
| 2014 | $3,496 | $48,270 | $10,400 | $37,870 |
| 2013 | -- | $50,820 | $10,955 | $39,865 |
Source: Public Records
Map
Nearby Homes
- 3577 Frenchpark Dr
- 3445 Steiner St
- 0 Blendon Bend Way Unit 225037483
- 4748 Black Sycamore Dr
- 4858 Farview Rd
- 3392 Trail Lane Ct
- 3378 Trail Lane Ct
- 4948 Black Sycamore Dr
- 4981 Black Sycamore Dr
- 4444 Trindel Way
- 4864 Honeysuckle Blvd
- 3084 Omega Dr
- 4555 Teton Ct
- 5047 Killowen Ct
- 3854 Deer Knoll Dr
- 2977 Ironstone Dr
- 2974 Footloose Dr
- 3843 Peak Ridge Dr
- 4476 Cliff Ridge Dr
- 3098 Bennington Ave
- 3454 Laurent Ct
- 3466 Laurent Ct
- 3448 Laurent Ct
- 3472 Laurent Ct
- 3463 Laurent Ct
- 3471 Laurent Ct
- 3442 Laurent Ct
- 3478 Laurent Ct
- 3455 Laurent Ct
- 4900 Whisper Creek Ct
- 3473 Westbay Dr
- 4894 Whisper Creek Ct
- 3479 Laurent Ct
- 3436 Laurent Ct
- 3461 Westbay Dr
- 4901 Whisper Creek Ct
- 3506 Frenchpark Dr
- 3467 Westbay Dr
- 3447 Laurent Ct
- 3484 Frenchpark Dr