Estimated Value: $272,635 - $316,000
3
Beds
2
Baths
1,521
Sq Ft
$189/Sq Ft
Est. Value
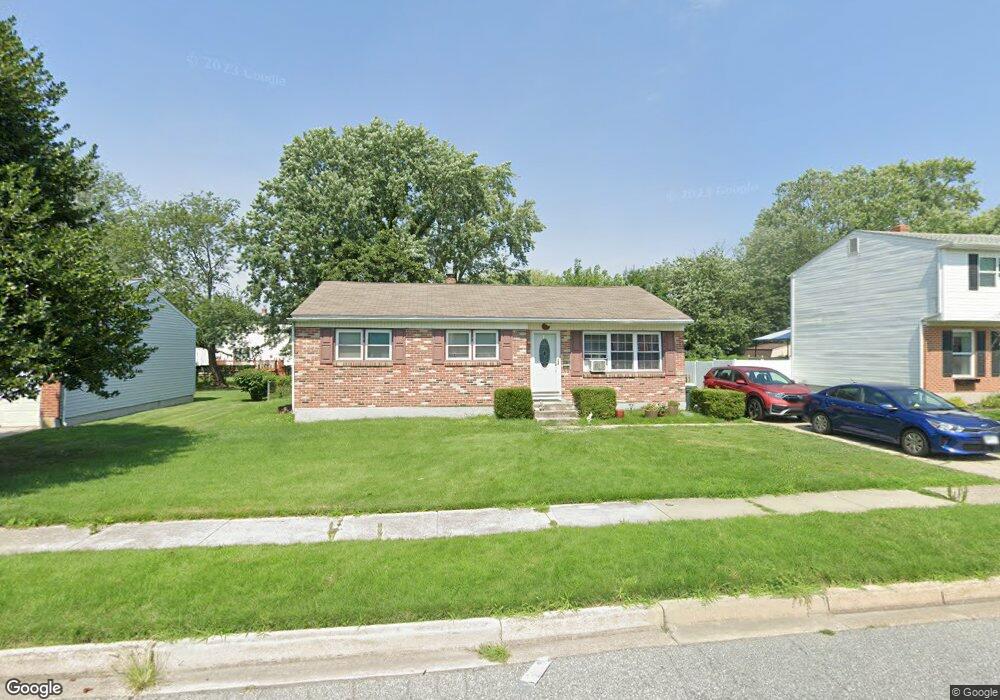
About This Home
This home is located at 347 Frear Dr Unit 5, Dover, DE 19901 and is currently estimated at $287,659, approximately $189 per square foot. 347 Frear Dr Unit 5 is a home located in Kent County with nearby schools including Towne Point Elementary School, William Henry Middle School, and Central Middle School.
Ownership History
Date
Name
Owned For
Owner Type
Purchase Details
Closed on
Jul 18, 2017
Sold by
Srp Sub Llc
Bought by
Big T Properties Delaware Llc
Current Estimated Value
Purchase Details
Closed on
Aug 27, 2013
Sold by
Messick James and Messick Amy
Bought by
Colfin Ai De 1 Llc
Purchase Details
Closed on
May 6, 2009
Sold by
Federal National Mortgage Association
Bought by
Messick James and Messick Amy
Home Financials for this Owner
Home Financials are based on the most recent Mortgage that was taken out on this home.
Original Mortgage
$131,572
Interest Rate
4.85%
Mortgage Type
FHA
Purchase Details
Closed on
Jun 8, 2006
Sold by
Kriss Robert J and Kriss Janet M
Bought by
Woleslagle Christine
Home Financials for this Owner
Home Financials are based on the most recent Mortgage that was taken out on this home.
Original Mortgage
$176,000
Interest Rate
6.62%
Mortgage Type
FHA
Create a Home Valuation Report for This Property
The Home Valuation Report is an in-depth analysis detailing your home's value as well as a comparison with similar homes in the area
Home Values in the Area
Average Home Value in this Area
Purchase History
| Date | Buyer | Sale Price | Title Company |
|---|---|---|---|
| Big T Properties Delaware Llc | $656,902 | None Available | |
| Colfin Ai De 1 Llc | $130,000 | None Available | |
| Messick James | -- | None Available | |
| Woleslagle Christine | $264,000 | None Available |
Source: Public Records
Mortgage History
| Date | Status | Borrower | Loan Amount |
|---|---|---|---|
| Previous Owner | Messick James | $131,572 | |
| Previous Owner | Woleslagle Christine | $176,000 |
Source: Public Records
Tax History
| Year | Tax Paid | Tax Assessment Tax Assessment Total Assessment is a certain percentage of the fair market value that is determined by local assessors to be the total taxable value of land and additions on the property. | Land | Improvement |
|---|---|---|---|---|
| 2025 | $1,415 | $240,700 | $91,000 | $149,700 |
| 2024 | $1,366 | $240,700 | $91,000 | $149,700 |
| 2023 | $1,172 | $39,800 | $9,600 | $30,200 |
| 2022 | $1,133 | $39,800 | $9,600 | $30,200 |
| 2021 | $1,091 | $39,800 | $9,600 | $30,200 |
| 2020 | $1,054 | $39,800 | $9,600 | $30,200 |
| 2019 | $996 | $39,800 | $9,600 | $30,200 |
| 2018 | $909 | $39,800 | $9,600 | $30,200 |
| 2017 | $894 | $39,800 | $0 | $0 |
| 2016 | $897 | $39,800 | $0 | $0 |
| 2015 | $885 | $39,800 | $0 | $0 |
| 2014 | -- | $39,800 | $0 | $0 |
Source: Public Records
Map
Nearby Homes
- 1014 White Oak Rd
- 40 Anchor Ln
- 348 W Wind Dr
- 108 N Halsey Rd
- 196 Willis Rd
- 750 Miller Dr
- 33 Spruance Rd
- 630 Maple Pkwy
- 915 E Division St
- 809 Bacon Ave
- 813 Bacon Ave
- 920 E Division St
- 71 Chatham Ct
- 59 Chatham Ct
- 57 Chatham Ct
- 263 Tea Party Trail
- 10 Loockerman Ct
- 760 E Loockerman St
- 42 S Edgehill Ave
- 529 Greenhill Rd
Your Personal Tour Guide
Ask me questions while you tour the home.