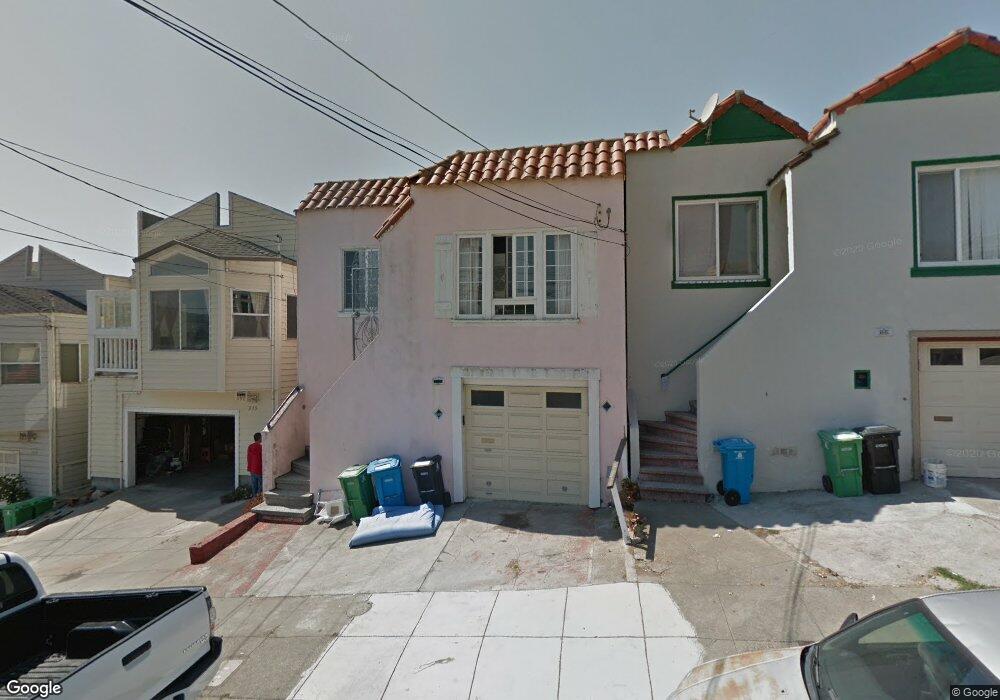
347 Head St San Francisco, CA 94132
Ingleside Heights NeighborhoodEstimated Value: $746,380 - $1,001,000
Studio
1
Bath
704
Sq Ft
$1,265/Sq Ft
Est. Value
About This Home
This home is located at 347 Head St, San Francisco, CA 94132 and is currently estimated at $890,845, approximately $1,265 per square foot. 347 Head St is a home located in San Francisco County with nearby schools including Ortega (Jose) Elementary School, Aptos Middle School, and Stratford School.
Ownership History
Date
Name
Owned For
Owner Type
Purchase Details
Closed on
Jun 3, 2018
Sold by
Xu Run Jie
Bought by
Xu Run Jie and The Run Ji9e Xu Trust
Current Estimated Value
Purchase Details
Closed on
Apr 12, 2010
Sold by
Xie Wen Sheng
Bought by
Xie Wen Sheng and Li Fan Jin
Home Financials for this Owner
Home Financials are based on the most recent Mortgage that was taken out on this home.
Original Mortgage
$300,000
Outstanding Balance
$199,315
Interest Rate
4.95%
Mortgage Type
New Conventional
Estimated Equity
$691,530
Purchase Details
Closed on
Jun 11, 1998
Sold by
Lowe S T and Lowe Mary
Bought by
Lowe S T and Lowe Mary
Purchase Details
Closed on
Mar 6, 1998
Sold by
Mamie Mullins and Williams Pearlie
Bought by
Xie Rui Shi and Xu Run Jie
Home Financials for this Owner
Home Financials are based on the most recent Mortgage that was taken out on this home.
Original Mortgage
$100,000
Interest Rate
7.11%
Create a Home Valuation Report for This Property
The Home Valuation Report is an in-depth analysis detailing your home's value as well as a comparison with similar homes in the area
Home Values in the Area
Average Home Value in this Area
Purchase History
| Date | Buyer | Sale Price | Title Company |
|---|---|---|---|
| Xu Run Jie | -- | None Available | |
| Xie Wen Sheng | -- | Chicago Title Company | |
| Lowe S T | -- | -- | |
| Xie Rui Shi | $140,000 | Fidelity National Title Co |
Source: Public Records
Mortgage History
| Date | Status | Borrower | Loan Amount |
|---|---|---|---|
| Open | Xie Wen Sheng | $300,000 | |
| Closed | Xie Rui Shi | $100,000 |
Source: Public Records
Tax History
| Year | Tax Paid | Tax Assessment Tax Assessment Total Assessment is a certain percentage of the fair market value that is determined by local assessors to be the total taxable value of land and additions on the property. | Land | Improvement |
|---|---|---|---|---|
| 2025 | $2,577 | $221,890 | $159,648 | $62,242 |
| 2024 | $2,577 | $217,540 | $156,518 | $61,022 |
| 2023 | $2,540 | $213,276 | $153,450 | $59,826 |
| 2022 | $2,495 | $209,096 | $150,442 | $58,654 |
| 2021 | $2,452 | $204,998 | $147,494 | $57,504 |
| 2020 | $2,459 | $202,898 | $145,982 | $56,916 |
| 2019 | $2,376 | $198,920 | $143,120 | $55,800 |
| 2018 | $2,298 | $195,020 | $140,314 | $54,706 |
| 2017 | $2,270 | $191,198 | $137,564 | $53,634 |
| 2016 | $2,207 | $187,452 | $134,868 | $52,584 |
| 2015 | $2,180 | $184,640 | $132,844 | $51,796 |
| 2014 | $2,123 | $181,024 | $130,242 | $50,782 |
Source: Public Records
Map
Nearby Homes
- 183 Victoria St
- 1 Head St
- 286 Sagamore St
- 270 Lobos St
- 8100 Oceanview Terrace Unit 209
- 8200 Oceanview Terrace Unit 414
- 729 Randolph St
- 8300 Oceanview Terrace Unit 209
- 8400 Oceanview Terrace Unit 208
- 224 Shields St
- 95 Santa Cruz Ave
- 759 Lakeview Ave
- 458 Victoria St
- 549 Orizaba Ave
- 299 Rhine St
- 14 Jules Ave
- 738 Shields St
- 125 Garfield St
- 62 Bepler St
- 106-108 Sadowa St
Your Personal Tour Guide
Ask me questions while you tour the home.