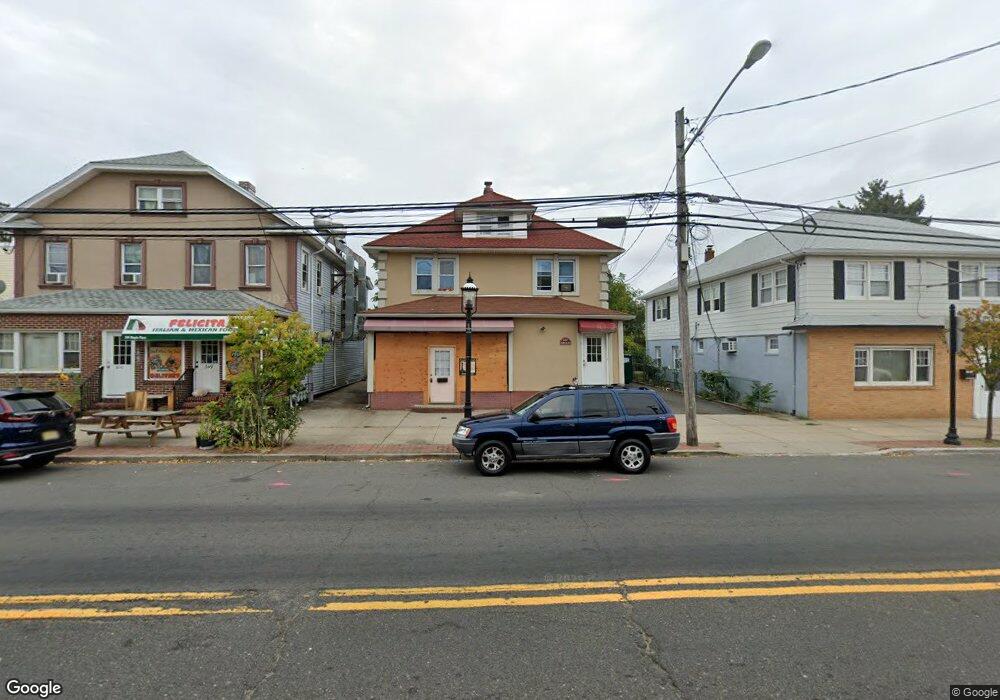
347 Maple Place Keyport, NJ 07735
Estimated Value: $490,668
--
Bed
--
Bath
2,213
Sq Ft
$222/Sq Ft
Est. Value
About This Home
This home is located at 347 Maple Place, Keyport, NJ 07735 and is currently estimated at $490,668, approximately $221 per square foot. 347 Maple Place is a home located in Monmouth County with nearby schools including Keyport Central School, Keyport High School, and St. Joseph Elementary School.
Ownership History
Date
Name
Owned For
Owner Type
Purchase Details
Closed on
Feb 15, 2024
Sold by
Hope Housing Llc
Bought by
Bj24 Llc
Current Estimated Value
Purchase Details
Closed on
Mar 16, 2021
Sold by
Demauro Nicholas R and Demauro Jennifer S
Bought by
Hope Housing Llc
Home Financials for this Owner
Home Financials are based on the most recent Mortgage that was taken out on this home.
Original Mortgage
$235,000
Interest Rate
2.9%
Mortgage Type
Commercial
Purchase Details
Closed on
Jan 11, 2021
Sold by
Todd Christopher
Bought by
Demauro Nicholas R and Demauro Jennifer S
Purchase Details
Closed on
Aug 24, 2015
Sold by
Werstil Howard and Werstil Susan
Bought by
Todd Christopher
Purchase Details
Closed on
Feb 21, 2003
Sold by
Szyszlo Stell
Bought by
Werstil Howard and Werstil Susan
Create a Home Valuation Report for This Property
The Home Valuation Report is an in-depth analysis detailing your home's value as well as a comparison with similar homes in the area
Home Values in the Area
Average Home Value in this Area
Purchase History
| Date | Buyer | Sale Price | Title Company |
|---|---|---|---|
| Bj24 Llc | $475,000 | Scott Title Services | |
| Bj24 Llc | $475,000 | Scott Title Services | |
| Hope Housing Llc | -- | Commonwealth Land Ttl Ins Co | |
| Hope Housing Llc | -- | Commonwealth Land Title | |
| Demauro Nicholas R | $360,000 | Commonwealth Title | |
| Todd Christopher | $303,000 | Multiple | |
| Werstil Howard | $200,000 | -- |
Source: Public Records
Mortgage History
| Date | Status | Borrower | Loan Amount |
|---|---|---|---|
| Previous Owner | Hope Housing Llc | $235,000 |
Source: Public Records
Tax History Compared to Growth
Tax History
| Year | Tax Paid | Tax Assessment Tax Assessment Total Assessment is a certain percentage of the fair market value that is determined by local assessors to be the total taxable value of land and additions on the property. | Land | Improvement |
|---|---|---|---|---|
| 2025 | $9,846 | $485,500 | $211,800 | $273,700 |
| 2024 | $8,869 | $461,400 | $201,700 | $259,700 |
| 2023 | $8,869 | $403,500 | $183,300 | $220,200 |
| 2022 | $9,298 | $368,000 | $163,700 | $204,300 |
| 2021 | $9,298 | $356,400 | $151,600 | $204,800 |
| 2020 | $9,435 | $359,000 | $144,400 | $214,600 |
| 2019 | $7,973 | $302,800 | $137,500 | $165,300 |
| 2018 | $8,130 | $302,800 | $137,500 | $165,300 |
| 2017 | $8,170 | $302,800 | $137,500 | $165,300 |
| 2016 | $8,039 | $302,800 | $137,500 | $165,300 |
| 2015 | $7,745 | $290,300 | $125,000 | $165,300 |
| 2014 | $7,404 | $279,800 | $115,000 | $164,800 |
Source: Public Records
Map
Nearby Homes
- 324 Maple Place
- 52 Highway 35
- 1 Hobart St
- 22 Lower Main St
- 253 Broadway
- 127 Chingarora Ave
- 557 Lloyd Rd Unit B
- 54 Chingarora Ave
- 95 Broadway
- 8 Chingarora Ave
- 369 Riverdale Dr
- 23 Mathiasen Place
- 154 Lower Main St
- 9 Monmouth Place
- 90 Saint Peters Place
- 14 Dolan Ave
- 47 Village Green Way
- 46 Parkview Dr
- 118 Village Green Way
- 18 Oak Knoll Dr