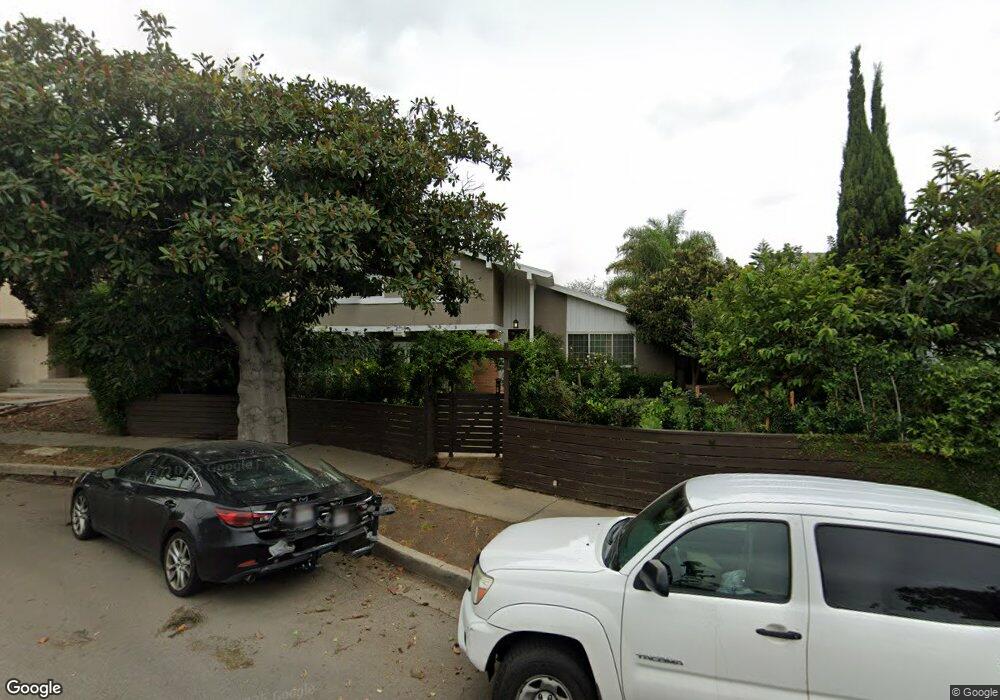
3470 Mclaughlin Ave Los Angeles, CA 90066
Mar Vista NeighborhoodEstimated Value: $2,153,000 - $2,552,000
4
Beds
3
Baths
2,614
Sq Ft
$911/Sq Ft
Est. Value
About This Home
This home is located at 3470 Mclaughlin Ave, Los Angeles, CA 90066 and is currently estimated at $2,381,767, approximately $911 per square foot. 3470 Mclaughlin Ave is a home located in Los Angeles County with nearby schools including Mar Vista Elementary, Daniel Webster Middle School, and Venice High School.
Ownership History
Date
Name
Owned For
Owner Type
Purchase Details
Closed on
Oct 4, 2016
Sold by
Ghaly Azmy
Bought by
Ghaly Azmy and Ghaly Nevine
Current Estimated Value
Purchase Details
Closed on
Sep 27, 1999
Sold by
Hanna Nevine Yassa
Bought by
Ghaly Azmy Fouad
Home Financials for this Owner
Home Financials are based on the most recent Mortgage that was taken out on this home.
Original Mortgage
$240,000
Interest Rate
7.97%
Purchase Details
Closed on
Aug 27, 1999
Sold by
Harris Phyllis M
Bought by
Ghaly Azmy Fouad and Hanna Nevine Yassa
Home Financials for this Owner
Home Financials are based on the most recent Mortgage that was taken out on this home.
Original Mortgage
$240,000
Interest Rate
7.97%
Purchase Details
Closed on
Mar 19, 1998
Sold by
Harris Phyllis M
Bought by
Harris Phyllis M and The Phyllis M Harris Trust
Create a Home Valuation Report for This Property
The Home Valuation Report is an in-depth analysis detailing your home's value as well as a comparison with similar homes in the area
Home Values in the Area
Average Home Value in this Area
Purchase History
| Date | Buyer | Sale Price | Title Company |
|---|---|---|---|
| Ghaly Azmy | -- | None Available | |
| Ghaly Azmy | -- | None Available | |
| Ghaly Azmy Fouad | -- | Southland Title | |
| Ghaly Azmy Fouad | $450,000 | Southland Title Company | |
| Harris Phyllis M | -- | -- |
Source: Public Records
Mortgage History
| Date | Status | Borrower | Loan Amount |
|---|---|---|---|
| Closed | Ghaly Azmy Fouad | $240,000 |
Source: Public Records
Tax History
| Year | Tax Paid | Tax Assessment Tax Assessment Total Assessment is a certain percentage of the fair market value that is determined by local assessors to be the total taxable value of land and additions on the property. | Land | Improvement |
|---|---|---|---|---|
| 2025 | $8,726 | $704,934 | $469,079 | $235,855 |
| 2024 | $8,726 | $691,113 | $459,882 | $231,231 |
| 2023 | $8,565 | $677,563 | $450,865 | $226,698 |
| 2022 | $8,178 | $664,278 | $442,025 | $222,253 |
| 2021 | $8,067 | $651,254 | $433,358 | $217,896 |
| 2019 | $7,831 | $631,939 | $420,505 | $211,434 |
| 2018 | $7,718 | $619,549 | $412,260 | $207,289 |
| 2016 | $7,366 | $595,493 | $396,252 | $199,241 |
| 2015 | $7,260 | $586,549 | $390,300 | $196,249 |
| 2014 | $7,291 | $575,060 | $382,655 | $192,405 |
Source: Public Records
Map
Nearby Homes
- 3420 Federal Ave
- 3491 Butler Ave
- 3522 S Barrington Ave
- 3552 Butler Ave
- 11500 Kingsland St
- 11622 Charnock Rd
- 3542 Stoner Ave
- 3320 Stoner Ave
- 11912 Charnock Rd
- 3517 Inglewood Blvd
- 11286 Westminster Ave Unit 101
- 3297 Granville Ave
- 11957 Modjeska Place
- 3230 S Barrington Ave
- 3218 S Barrington Ave
- 3662 Stoner Ave
- 3500 Tuller Ave
- 3524 Grand View Blvd
- 3728 S Barrington Ave
- 3714 Corinth Ave
- 3476 Mclaughlin Ave
- 3466 Mclaughlin Ave
- 3482 Mclaughlin Ave
- 3460 Mclaughlin Ave
- 3467 St Susan Place
- 3461 St Susan Place
- 3488 Mclaughlin Ave
- 3471 St Susan Place
- 11535 Vienna Way
- 3455 St Susan Place
- 3501 St Susan Place
- 3475 St Susan Place
- 3505 St Susan Place
- 3450 Mclaughlin Ave
- 3469 Mclaughlin Ave
- 3475 Mclaughlin Ave
- 11631 Westminster Ave
- 11625 Westminster Ave
- 11635 Westminster Ave
- 3465 Mclaughlin Ave
Your Personal Tour Guide
Ask me questions while you tour the home.