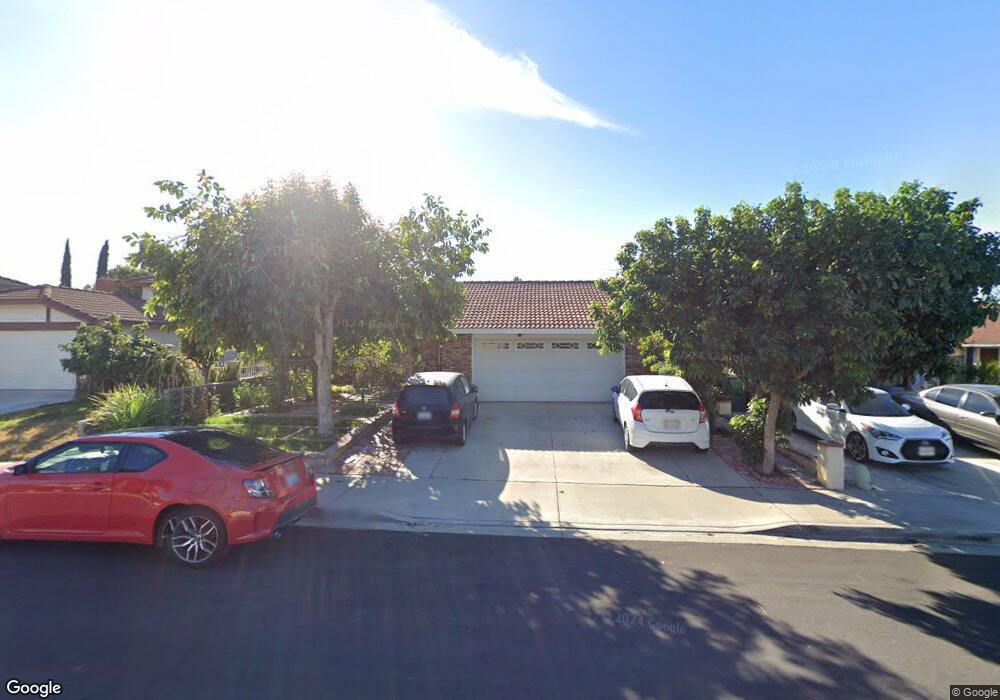
3476 Siskiyou Cir Riverside, CA 92503
Estimated Value: $598,477 - $624,000
4
Beds
2
Baths
1,386
Sq Ft
$445/Sq Ft
Est. Value
About This Home
This home is located at 3476 Siskiyou Cir, Riverside, CA 92503 and is currently estimated at $616,619, approximately $444 per square foot. 3476 Siskiyou Cir is a home located in Riverside County with nearby schools including Lake Hills Elementary School, Ysmael Villegas Middle School, and Hillcrest High School.
Ownership History
Date
Name
Owned For
Owner Type
Purchase Details
Closed on
Dec 2, 2005
Sold by
Chau Sarun
Bought by
Chau Sarun and Chau Boworth
Current Estimated Value
Home Financials for this Owner
Home Financials are based on the most recent Mortgage that was taken out on this home.
Original Mortgage
$150,000
Interest Rate
6.14%
Mortgage Type
New Conventional
Purchase Details
Closed on
Jan 30, 1995
Sold by
Household Financial Services Inc
Bought by
Chau Sarun
Home Financials for this Owner
Home Financials are based on the most recent Mortgage that was taken out on this home.
Original Mortgage
$95,120
Interest Rate
9.2%
Purchase Details
Closed on
Sep 15, 1994
Sold by
Jordan Carol J and Stonebraker Cherie L
Bought by
Household Financial Services Inc and Mtglq Investors Lp
Purchase Details
Closed on
Aug 16, 1993
Sold by
Stonebraker Cherie L
Bought by
Jordan Carol J
Create a Home Valuation Report for This Property
The Home Valuation Report is an in-depth analysis detailing your home's value as well as a comparison with similar homes in the area
Home Values in the Area
Average Home Value in this Area
Purchase History
| Date | Buyer | Sale Price | Title Company |
|---|---|---|---|
| Chau Sarun | -- | Ticor Title Company Of Ca | |
| Chau Sarun | $119,000 | Fidelity National Title Ins | |
| Household Financial Services Inc | $157,268 | World Title Company | |
| Jordan Carol J | -- | -- |
Source: Public Records
Mortgage History
| Date | Status | Borrower | Loan Amount |
|---|---|---|---|
| Closed | Chau Sarun | $150,000 | |
| Closed | Chau Sarun | $95,120 |
Source: Public Records
Tax History
| Year | Tax Paid | Tax Assessment Tax Assessment Total Assessment is a certain percentage of the fair market value that is determined by local assessors to be the total taxable value of land and additions on the property. | Land | Improvement |
|---|---|---|---|---|
| 2025 | $3,155 | $199,843 | $75,567 | $124,276 |
| 2023 | $3,155 | $192,085 | $72,634 | $119,451 |
| 2022 | $2,907 | $188,319 | $71,210 | $117,109 |
| 2021 | $2,841 | $184,627 | $69,814 | $114,813 |
| 2020 | $2,786 | $182,735 | $69,099 | $113,636 |
| 2019 | $2,754 | $179,153 | $67,745 | $111,408 |
| 2018 | $2,711 | $175,641 | $66,418 | $109,223 |
| 2017 | $2,656 | $172,198 | $65,116 | $107,082 |
| 2016 | $2,594 | $168,823 | $63,840 | $104,983 |
| 2015 | $2,531 | $166,289 | $62,882 | $103,407 |
| 2014 | $2,498 | $163,034 | $61,651 | $101,383 |
Source: Public Records
Map
Nearby Homes
- 3447 Yuba Cir
- 12740 Tehama Cir
- 12671 Hollyglen Cir
- 3565 Dixie Ln
- 12840 Mayflower Ct
- 3350 May Ct
- 3500 Buchanan St Unit 120
- 3500 Buchanan St Unit 24
- 3500 Buchanan St Unit 145
- 3500 Buchanan St Unit 173
- 3500 Buchanan St Unit 103
- 3500 Buchanan St Unit 138
- 3500 Buchanan St Unit 73
- 3500 Buchanan St Unit 117
- 3500 Buchanan St Unit 107
- 3500 Buchanan St Unit 162
- 3883 SPC 45 Buchanan St
- 13006 August Cir
- 3700 Buchanan St Unit 180
- 3700 Buchanan St Unit 98
- 3466 Siskiyou Cir
- 3486 Siskiyou Cir
- 3456 Siskiyou Cir
- 3496 Siskiyou Cir
- 3477 Yuba Cir
- 3467 Yuba Cir
- 3487 Yuba Cir
- 3457 Yuba Cir
- 3446 Siskiyou Cir
- 3497 Yuba Cir
- 3506 Siskiyou Cir
- 3485 Siskiyou Cir
- 3465 Siskiyou Cir
- 3507 Yuba Cir
- 3495 Siskiyou Cir
- 3455 Siskiyou Cir
- 3436 Siskiyou Cir
- 3505 Siskiyou Cir
- 3445 Siskiyou Cir
- 3426 Siskiyou Cir
Your Personal Tour Guide
Ask me questions while you tour the home.