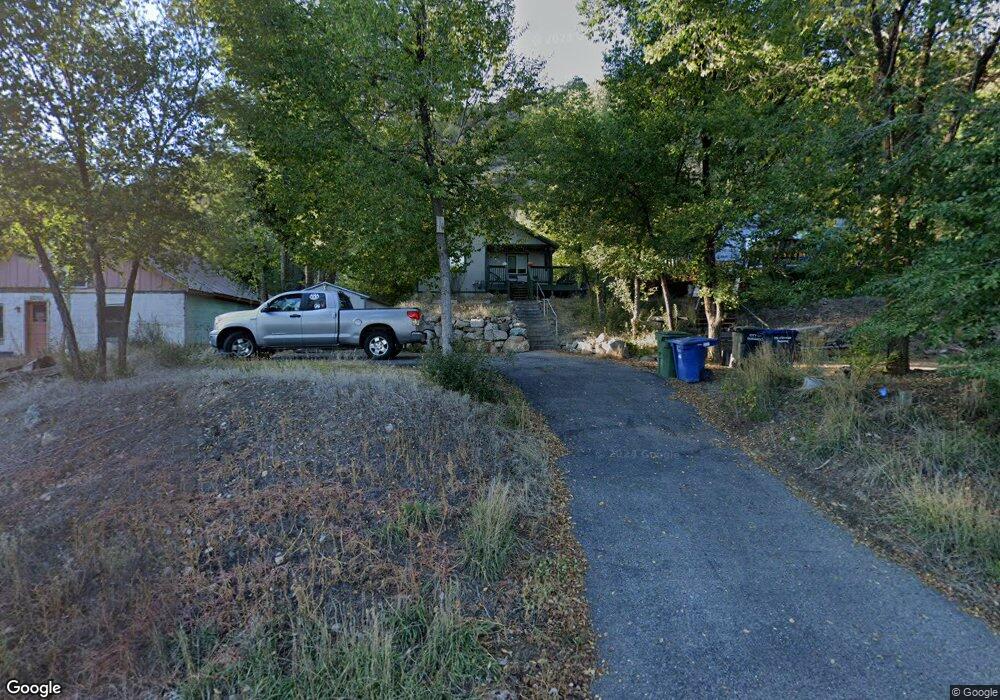
3479 W 2nd Ave Unit 3479 W Second Ave. Durango, CO 81301
Estimated Value: $603,897 - $732,000
3
Beds
1
Bath
1,118
Sq Ft
$592/Sq Ft
Est. Value
About This Home
This home is located at 3479 W 2nd Ave Unit 3479 W Second Ave., Durango, CO 81301 and is currently estimated at $661,474, approximately $591 per square foot. 3479 W 2nd Ave Unit 3479 W Second Ave. is a home located in La Plata County with nearby schools including Needham Elementary School, Miller Middle School, and Durango High School.
Ownership History
Date
Name
Owned For
Owner Type
Purchase Details
Closed on
Apr 30, 2012
Sold by
Thompson Donald R and Thompson Patricia A
Bought by
The Thompson Family Trust
Current Estimated Value
Home Financials for this Owner
Home Financials are based on the most recent Mortgage that was taken out on this home.
Original Mortgage
$187,500
Outstanding Balance
$129,508
Interest Rate
3.91%
Mortgage Type
New Conventional
Estimated Equity
$531,966
Purchase Details
Closed on
Mar 28, 2012
Sold by
Williams Heather J
Bought by
Thompson Donald R and Thompson Patricia A
Home Financials for this Owner
Home Financials are based on the most recent Mortgage that was taken out on this home.
Original Mortgage
$187,500
Outstanding Balance
$129,508
Interest Rate
3.91%
Mortgage Type
New Conventional
Estimated Equity
$531,966
Purchase Details
Closed on
Oct 3, 2008
Sold by
Williams Anna and Williams Anna D
Bought by
Williams Heather J
Create a Home Valuation Report for This Property
The Home Valuation Report is an in-depth analysis detailing your home's value as well as a comparison with similar homes in the area
Home Values in the Area
Average Home Value in this Area
Purchase History
| Date | Buyer | Sale Price | Title Company |
|---|---|---|---|
| The Thompson Family Trust | -- | None Available | |
| Thompson Donald R | $250,000 | Clt | |
| Williams Heather J | -- | None Available |
Source: Public Records
Mortgage History
| Date | Status | Borrower | Loan Amount |
|---|---|---|---|
| Open | Thompson Donald R | $187,500 |
Source: Public Records
Tax History Compared to Growth
Tax History
| Year | Tax Paid | Tax Assessment Tax Assessment Total Assessment is a certain percentage of the fair market value that is determined by local assessors to be the total taxable value of land and additions on the property. | Land | Improvement |
|---|---|---|---|---|
| 2025 | $1,378 | $39,590 | $18,240 | $21,350 |
| 2024 | $1,172 | $29,160 | $13,070 | $16,090 |
| 2023 | $1,172 | $32,150 | $14,410 | $17,740 |
| 2022 | $1,079 | $26,540 | $12,770 | $13,770 |
| 2021 | $1,084 | $27,300 | $13,130 | $14,170 |
| 2020 | $1,011 | $26,290 | $12,970 | $13,320 |
| 2019 | $967 | $26,290 | $12,970 | $13,320 |
| 2018 | $910 | $25,050 | $12,300 | $12,750 |
| 2017 | $890 | $25,050 | $12,300 | $12,750 |
| 2016 | $811 | $24,890 | $11,750 | $13,140 |
| 2015 | $760 | $24,890 | $11,750 | $13,140 |
| 2014 | -- | $22,640 | $11,290 | $11,350 |
| 2013 | -- | $22,640 | $11,290 | $11,350 |
Source: Public Records
Map
Nearby Homes
- 3475 W 2nd Ave
- 3416 Main Ave Unit C2
- 3226 W 4th Ave
- 3211 W 2 Nd Ave
- 90 Animas View Dr Unit 5
- 2977 E 2nd Ave
- 3015 Hillside Ave
- 611 Sunnyside Dr
- 2910 Junction St
- 35 Sunshine Ct Unit 1
- 3112 E 7th Ave
- 288 Animas View Dr
- 2807 Junction St
- 457 Animas View Dr Unit 22
- 5 Pinetree Way
- 543 Animas View Dr Unit 19
- 582 Animas View Dr Unit 4
- 2920 Holly Ave Unit 104
- 601 Animas View Dr Unit 204A
- 2504 W 3rd Ave
- 3479 W 2nd Ave
- 3481 W 2nd Ave
- 3501 W 2nd Ave
- 3473 W 2nd Ave
- 3505 W 2nd Ave
- 3469 W 2nd Ave
- 3475 Main Ave
- 3465 W 2nd Ave
- 3473 Main Ave Unit 24
- 3473 Main Ave
- 3473 Main Ave Unit 14
- 3515 Main Ave
- 3455 W 2nd Ave
- N Main Ave - Como 3 Unit Como Unit 3
- N Main Ave - Amalfi 5 Unit Amalfi Unit 5
- N Main Ave - Umbria 3 Unit Umbria Unit 3
- N Main Ave - Amalfi 2 Unit Amalfi Unit 2
- N Main Ave - Amalfi 4 Unit Amalfi Unit 4
- N Main Ave Unit Unit Above Commercial
- 3478 Main Ave