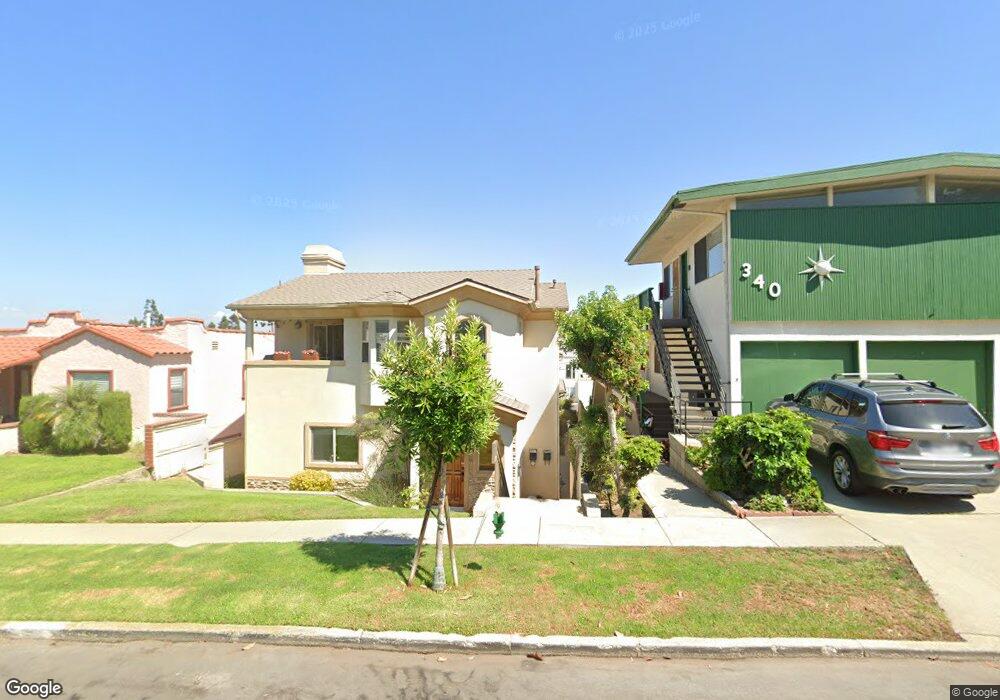
348 Concord St Unit B El Segundo, CA 90245
Estimated Value: $1,367,000 - $2,177,000
3
Beds
3
Baths
1,804
Sq Ft
$980/Sq Ft
Est. Value
About This Home
This home is located at 348 Concord St Unit B, El Segundo, CA 90245 and is currently estimated at $1,767,481, approximately $979 per square foot. 348 Concord St Unit B is a home located in Los Angeles County with nearby schools including Richmond Street Elementary School, El Segundo Middle School, and El Segundo High School.
Ownership History
Date
Name
Owned For
Owner Type
Purchase Details
Closed on
Sep 19, 2017
Sold by
Robilotta James R and Robilotta Son Hui
Bought by
Robilotta Danielle Kim
Current Estimated Value
Home Financials for this Owner
Home Financials are based on the most recent Mortgage that was taken out on this home.
Original Mortgage
$315,000
Outstanding Balance
$262,480
Interest Rate
3.82%
Mortgage Type
New Conventional
Estimated Equity
$1,505,001
Purchase Details
Closed on
Mar 5, 2002
Sold by
Maples Craig and Maples Janine
Bought by
Robilotta James R and Robilotta Son Hui
Home Financials for this Owner
Home Financials are based on the most recent Mortgage that was taken out on this home.
Original Mortgage
$351,200
Interest Rate
6.69%
Create a Home Valuation Report for This Property
The Home Valuation Report is an in-depth analysis detailing your home's value as well as a comparison with similar homes in the area
Home Values in the Area
Average Home Value in this Area
Purchase History
| Date | Buyer | Sale Price | Title Company |
|---|---|---|---|
| Robilotta Danielle Kim | $875,000 | Progressive Title Company | |
| Robilotta James R | $439,000 | Lawyers Title |
Source: Public Records
Mortgage History
| Date | Status | Borrower | Loan Amount |
|---|---|---|---|
| Open | Robilotta Danielle Kim | $315,000 | |
| Previous Owner | Robilotta James R | $351,200 | |
| Closed | Robilotta James R | $43,850 |
Source: Public Records
Tax History
| Year | Tax Paid | Tax Assessment Tax Assessment Total Assessment is a certain percentage of the fair market value that is determined by local assessors to be the total taxable value of land and additions on the property. | Land | Improvement |
|---|---|---|---|---|
| 2025 | $7,020 | $635,799 | $331,658 | $304,141 |
| 2024 | $7,020 | $623,333 | $325,155 | $298,178 |
| 2023 | $6,837 | $611,112 | $318,780 | $292,332 |
| 2022 | $6,909 | $599,130 | $312,530 | $286,600 |
| 2021 | $6,805 | $587,383 | $306,402 | $280,981 |
| 2019 | $6,570 | $569,963 | $297,315 | $272,648 |
| 2018 | $6,242 | $558,788 | $291,486 | $267,302 |
| 2016 | $6,061 | $537,091 | $280,168 | $256,923 |
| 2015 | $5,986 | $529,024 | $275,960 | $253,064 |
| 2014 | $5,861 | $518,662 | $270,555 | $248,107 |
Source: Public Records
Map
Nearby Homes
- 328 Virginia St Unit 4
- 412 Richmond St
- 417 Standard St
- 211 E Pine Ave
- 355 Hillcrest St
- 228 Arena St Unit B
- 228 Arena St Unit A
- 710 Virginia St
- 226 Arena St Unit B
- 226 Arena St
- 724 Loma Vista St
- 701 Hillcrest St
- 529 Sierra Place
- 606 Penn St
- 329 E Maple Ave
- 804 Hillcrest St
- 432 Lomita St
- 121 E Walnut Ave
- 924 Main St
- 219 W Acacia Ave
- 348 Concord St Unit C
- 348 Concord St Unit A
- 350 Concord St
- 350 1/2 Concord St
- 354 Concord St Unit 4
- 330 Concord St Unit C
- 330 Concord St Unit A
- 330 Concord St Unit B
- 361 Concord St Unit 7
- 361 Concord St Unit 6
- 224 W Holly Ave
- 324 Concord St
- 347 Concord St
- 320 Concord St Unit C
- 320 Concord St Unit A
- 320 Concord St Unit B
- 355 Concord St
- 355 Concord St Unit 3
- 355 Concord St Unit 2
- 355 Concord St Unit 1
Your Personal Tour Guide
Ask me questions while you tour the home.