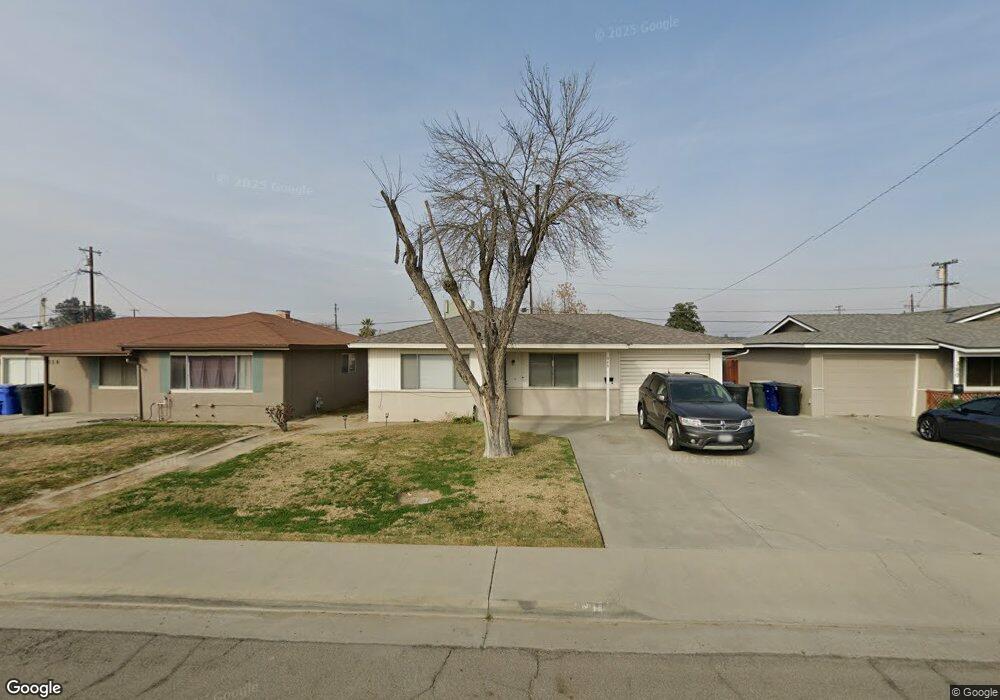
348 E D St Lemoore, CA 93245
Estimated Value: $221,000 - $302,000
3
Beds
2
Baths
1,096
Sq Ft
$249/Sq Ft
Est. Value
About This Home
This home is located at 348 E D St, Lemoore, CA 93245 and is currently estimated at $273,264, approximately $249 per square foot. 348 E D St is a home located in Kings County with nearby schools including Lemoore Elementary School, Liberty Middle School, and Lemoore High School.
Ownership History
Date
Name
Owned For
Owner Type
Purchase Details
Closed on
Sep 13, 2021
Sold by
Johnson Alan J and Johnson Cathy E
Bought by
Johnson Alan J and Johnson Cathy E
Current Estimated Value
Purchase Details
Closed on
Sep 14, 2020
Sold by
Robert Johnson Carl
Bought by
Johnson Carl Robert and Johnson Gerald
Home Financials for this Owner
Home Financials are based on the most recent Mortgage that was taken out on this home.
Original Mortgage
$35,000
Outstanding Balance
$30,705
Interest Rate
2.9%
Mortgage Type
New Conventional
Estimated Equity
$242,559
Purchase Details
Closed on
Aug 10, 2020
Sold by
Robert Johnson Carl
Bought by
Johnson Carl Robert and Johnson Gerald
Home Financials for this Owner
Home Financials are based on the most recent Mortgage that was taken out on this home.
Original Mortgage
$35,000
Outstanding Balance
$30,705
Interest Rate
2.9%
Mortgage Type
New Conventional
Estimated Equity
$242,559
Purchase Details
Closed on
Aug 4, 2020
Sold by
Johnson Carl Robert and Johnson Geraldine J
Bought by
Johnson Alan J and Johnson Cathy E
Home Financials for this Owner
Home Financials are based on the most recent Mortgage that was taken out on this home.
Original Mortgage
$35,000
Outstanding Balance
$30,705
Interest Rate
2.9%
Mortgage Type
New Conventional
Estimated Equity
$242,559
Purchase Details
Closed on
Feb 28, 2006
Sold by
Martinez Louie J
Bought by
Martinez Ernest U
Purchase Details
Closed on
Oct 12, 1999
Sold by
Martinez Louis J and Johnson Geraldine R
Bought by
Johnson Carl Robert and Johnson Geraldine Rosa
Create a Home Valuation Report for This Property
The Home Valuation Report is an in-depth analysis detailing your home's value as well as a comparison with similar homes in the area
Home Values in the Area
Average Home Value in this Area
Purchase History
| Date | Buyer | Sale Price | Title Company |
|---|---|---|---|
| Johnson Alan J | -- | None Available | |
| Johnson Carl Robert | -- | -- | |
| Johnson Carl Robert | -- | -- | |
| Johnson Alan J | $130,000 | Chicago Title | |
| Martinez Ernest U | -- | None Available | |
| Johnson Carl Robert | -- | -- |
Source: Public Records
Mortgage History
| Date | Status | Borrower | Loan Amount |
|---|---|---|---|
| Open | Johnson Alan J | $35,000 |
Source: Public Records
Tax History
| Year | Tax Paid | Tax Assessment Tax Assessment Total Assessment is a certain percentage of the fair market value that is determined by local assessors to be the total taxable value of land and additions on the property. | Land | Improvement |
|---|---|---|---|---|
| 2025 | $2,031 | $200,247 | $75,769 | $124,478 |
| 2023 | $2,031 | $192,474 | $72,828 | $119,646 |
| 2022 | $2,132 | $188,700 | $71,400 | $117,300 |
| 2021 | $2,078 | $185,000 | $70,000 | $115,000 |
| 2020 | $455 | $40,353 | $7,845 | $32,508 |
| 2019 | $452 | $39,562 | $7,691 | $31,871 |
| 2018 | $425 | $38,786 | $7,540 | $31,246 |
| 2017 | $426 | $38,025 | $7,392 | $30,633 |
| 2016 | $400 | $37,279 | $7,247 | $30,032 |
| 2015 | $399 | $36,719 | $7,138 | $29,581 |
| 2014 | $387 | $36,000 | $6,998 | $29,002 |
Source: Public Records
Map
Nearby Homes
Your Personal Tour Guide
Ask me questions while you tour the home.