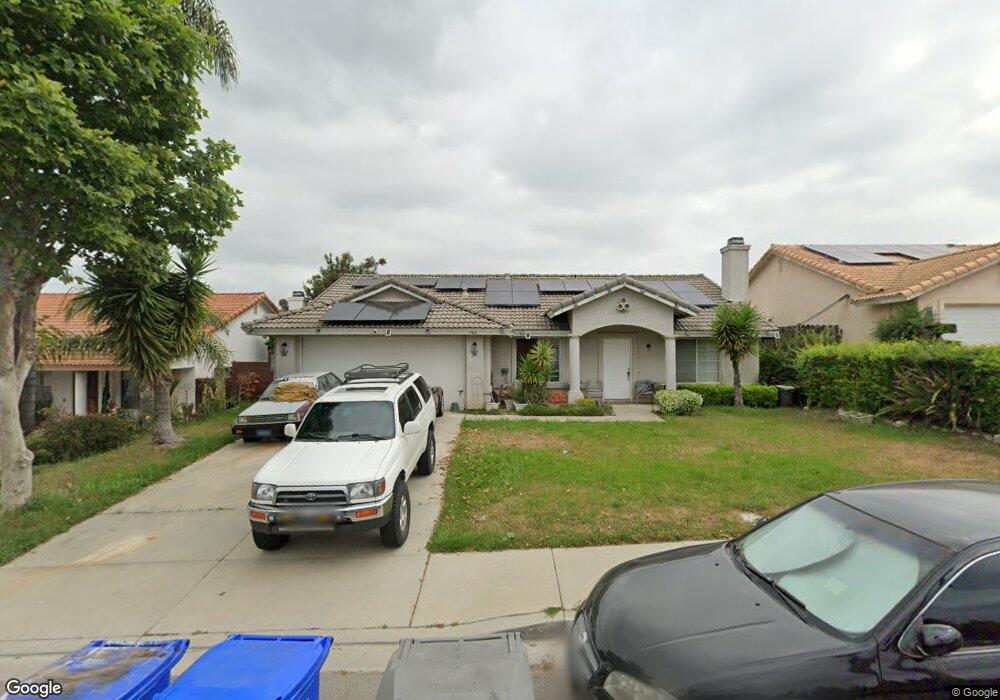
348 Womack Ln Fallbrook, CA 92028
Estimated Value: $680,000 - $719,000
3
Beds
2
Baths
1,472
Sq Ft
$471/Sq Ft
Est. Value
About This Home
This home is located at 348 Womack Ln, Fallbrook, CA 92028 and is currently estimated at $693,569, approximately $471 per square foot. 348 Womack Ln is a home located in San Diego County with nearby schools including La Paloma Elementary School, James E. Potter Intermediate School, and Fallbrook High School.
Ownership History
Date
Name
Owned For
Owner Type
Purchase Details
Closed on
Jul 9, 2014
Sold by
Gutierrez Hector
Bought by
Gutierrez Hector G
Current Estimated Value
Home Financials for this Owner
Home Financials are based on the most recent Mortgage that was taken out on this home.
Original Mortgage
$203,501
Outstanding Balance
$154,658
Interest Rate
4.1%
Mortgage Type
VA
Estimated Equity
$538,911
Purchase Details
Closed on
Sep 16, 1993
Sold by
Hawthorne S & L Assoc
Bought by
Gutierrez Hector and Gutierrez Sally
Home Financials for this Owner
Home Financials are based on the most recent Mortgage that was taken out on this home.
Original Mortgage
$140,737
Interest Rate
7.13%
Mortgage Type
VA
Create a Home Valuation Report for This Property
The Home Valuation Report is an in-depth analysis detailing your home's value as well as a comparison with similar homes in the area
Home Values in the Area
Average Home Value in this Area
Purchase History
| Date | Buyer | Sale Price | Title Company |
|---|---|---|---|
| Gutierrez Hector G | -- | Nextitle | |
| Gutierrez Hector | $139,000 | First American Title |
Source: Public Records
Mortgage History
| Date | Status | Borrower | Loan Amount |
|---|---|---|---|
| Open | Gutierrez Hector G | $203,501 | |
| Closed | Gutierrez Hector | $140,737 |
Source: Public Records
Tax History
| Year | Tax Paid | Tax Assessment Tax Assessment Total Assessment is a certain percentage of the fair market value that is determined by local assessors to be the total taxable value of land and additions on the property. | Land | Improvement |
|---|---|---|---|---|
| 2025 | $2,429 | $236,225 | $110,466 | $125,759 |
| 2024 | $2,429 | $231,594 | $108,300 | $123,294 |
| 2023 | $2,364 | $227,054 | $106,177 | $120,877 |
| 2022 | $2,363 | $222,603 | $104,096 | $118,507 |
| 2021 | $2,287 | $218,239 | $102,055 | $116,184 |
| 2020 | $2,307 | $216,002 | $101,009 | $114,993 |
| 2019 | $2,264 | $211,768 | $99,029 | $112,739 |
| 2018 | $2,229 | $207,617 | $97,088 | $110,529 |
| 2017 | $751 | $203,547 | $95,185 | $108,362 |
| 2016 | $2,127 | $199,557 | $93,319 | $106,238 |
| 2015 | $2,086 | $196,561 | $91,918 | $104,643 |
| 2014 | $2,046 | $192,712 | $90,118 | $102,594 |
Source: Public Records
Map
Nearby Homes
- 1024 Kiel Rd
- 522 S Pico Ave
- 508 Village View Place
- 535 Shady Glen Dr
- 210 S Orange Ave
- 206 Via Oro Verde
- 502 E Elder St
- 741 Rossiter Ln
- 956 Woodcreek Rd
- 214 Summit Ave
- 1003 Via Unidos
- 445 Poets Square
- 0 Via Vonnie Unit SW26054903
- 868 E Alvarado St Unit 7
- 868 E Alvarado St Unit 47
- 408 N Pico Ave
- 903 Crescent Bend
- 0 Laurine Ln
- 832 Magarian Rd
- 113 Gardenside Ct
- 336 Womack Ln
- 360 Womack Ln
- 351 Old Stage Ct
- 363 Old Stage Ct
- 339 Old Stage Ct
- 324 Womack Ln
- 372 Womack Ln
- 375 Old Stage Ct
- 327 Old Stage Ct
- 321 Womack Ln
- 333 Womack Ln
- 312 Womack Ln
- 405 Womack Ln
- 313 Womack Ln
- 384 Womack Ln
- 315 Old Stage Ct
- 387 Old Stage Ct
- 409 Womack Ln
- 350 Old Stage Ct
- 362 Old Stage Ct
Your Personal Tour Guide
Ask me questions while you tour the home.