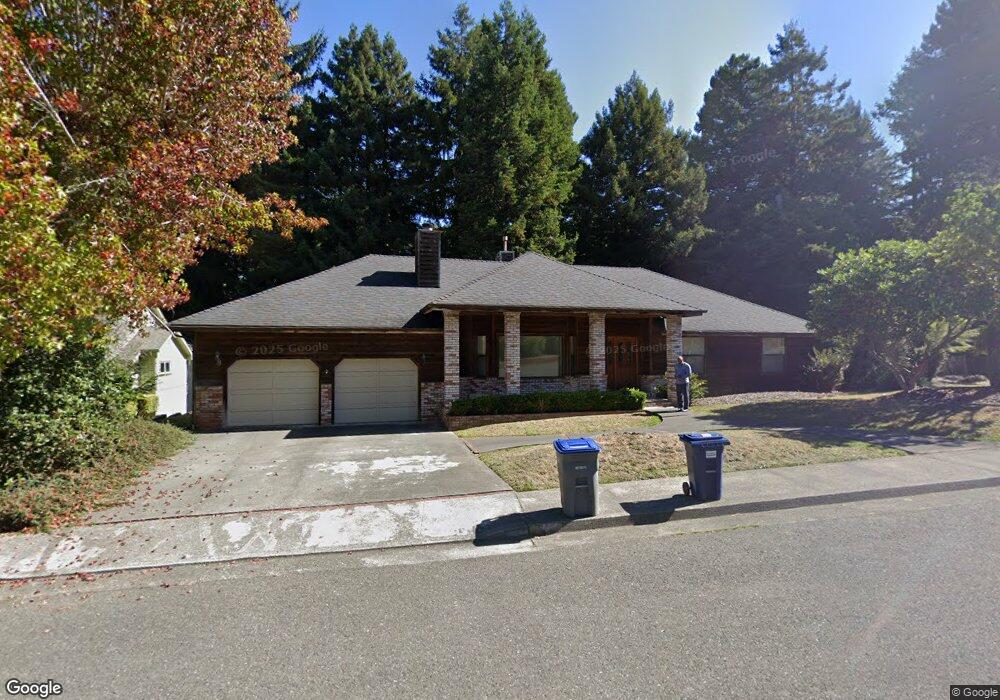
3480 Coombs Dr Arcata, CA 95521
Curtis Heights-Woodland Heights NeighborhoodEstimated Value: $677,295 - $873,000
3
Beds
2
Baths
2,200
Sq Ft
$343/Sq Ft
Est. Value
About This Home
This home is located at 3480 Coombs Dr, Arcata, CA 95521 and is currently estimated at $754,074, approximately $342 per square foot. 3480 Coombs Dr is a home located in Humboldt County with nearby schools including Pacific Union Elementary School, Arcata High School, and Trillium Charter School.
Ownership History
Date
Name
Owned For
Owner Type
Purchase Details
Closed on
Jan 27, 2012
Sold by
Hirt Michael and Hirt Natalie
Bought by
Hirt Michael and Hirt Natalie
Current Estimated Value
Purchase Details
Closed on
Jan 22, 2004
Sold by
Shell Randall A and Shell Marilyn I
Bought by
Hirt Michael and Hirt Alexis Carol
Home Financials for this Owner
Home Financials are based on the most recent Mortgage that was taken out on this home.
Original Mortgage
$200,000
Outstanding Balance
$86,017
Interest Rate
4.75%
Mortgage Type
Purchase Money Mortgage
Estimated Equity
$668,057
Purchase Details
Closed on
Sep 27, 2001
Sold by
Brosek Ivan J
Bought by
Shell Randall A and Shell Marilyn I
Home Financials for this Owner
Home Financials are based on the most recent Mortgage that was taken out on this home.
Original Mortgage
$242,400
Interest Rate
6.84%
Mortgage Type
Purchase Money Mortgage
Create a Home Valuation Report for This Property
The Home Valuation Report is an in-depth analysis detailing your home's value as well as a comparison with similar homes in the area
Home Values in the Area
Average Home Value in this Area
Purchase History
| Date | Buyer | Sale Price | Title Company |
|---|---|---|---|
| Hirt Michael | -- | None Available | |
| Hirt Michael | $445,000 | First American Title Ins Co | |
| Shell Randall A | $303,000 | First American Title Co |
Source: Public Records
Mortgage History
| Date | Status | Borrower | Loan Amount |
|---|---|---|---|
| Open | Hirt Michael | $200,000 | |
| Previous Owner | Shell Randall A | $242,400 |
Source: Public Records
Tax History
| Year | Tax Paid | Tax Assessment Tax Assessment Total Assessment is a certain percentage of the fair market value that is determined by local assessors to be the total taxable value of land and additions on the property. | Land | Improvement |
|---|---|---|---|---|
| 2025 | $6,747 | $632,682 | $213,261 | $419,421 |
| 2024 | $6,747 | $620,278 | $209,080 | $411,198 |
| 2023 | $6,746 | $608,117 | $204,981 | $403,136 |
| 2022 | $6,708 | $596,194 | $200,962 | $395,232 |
| 2021 | $6,668 | $584,505 | $197,022 | $387,483 |
| 2020 | $6,508 | $578,512 | $195,002 | $383,510 |
| 2019 | $6,405 | $567,170 | $191,179 | $375,991 |
| 2018 | $5,981 | $556,050 | $187,431 | $368,619 |
| 2017 | $5,888 | $545,148 | $183,756 | $361,392 |
| 2016 | $5,763 | $534,459 | $180,153 | $354,306 |
| 2015 | $5,657 | $526,431 | $177,447 | $348,984 |
| 2014 | $5,574 | $516,120 | $173,972 | $342,148 |
Source: Public Records
Map
Nearby Homes
- 812 Diamond Dr
- 3122 St Louis Rd
- 1096 Diamond Dr
- 1346 Diamond Dr
- 2700 Meadow Creek Way
- 3028 Alliance Rd
- 330 California Ave
- 3030 Alliance Rd
- 1254 Mccallum Cir
- 113 Sylva St
- 119 Sylva St
- 4965 Monterey Dr
- 970 Courtyard Cir
- 1283 Poplar Dr
- 1666 Stewart Ave
- 2084 Mustang Ln
- 2078 Shetland Ln
- 2203 Appaloosa Ln
- 3106 Brian Ct
- 836 12th and 1192 I St
Your Personal Tour Guide
Ask me questions while you tour the home.