Estimated Value: $426,000 - $586,000
3
Beds
3
Baths
2,189
Sq Ft
$240/Sq Ft
Est. Value
About This Home
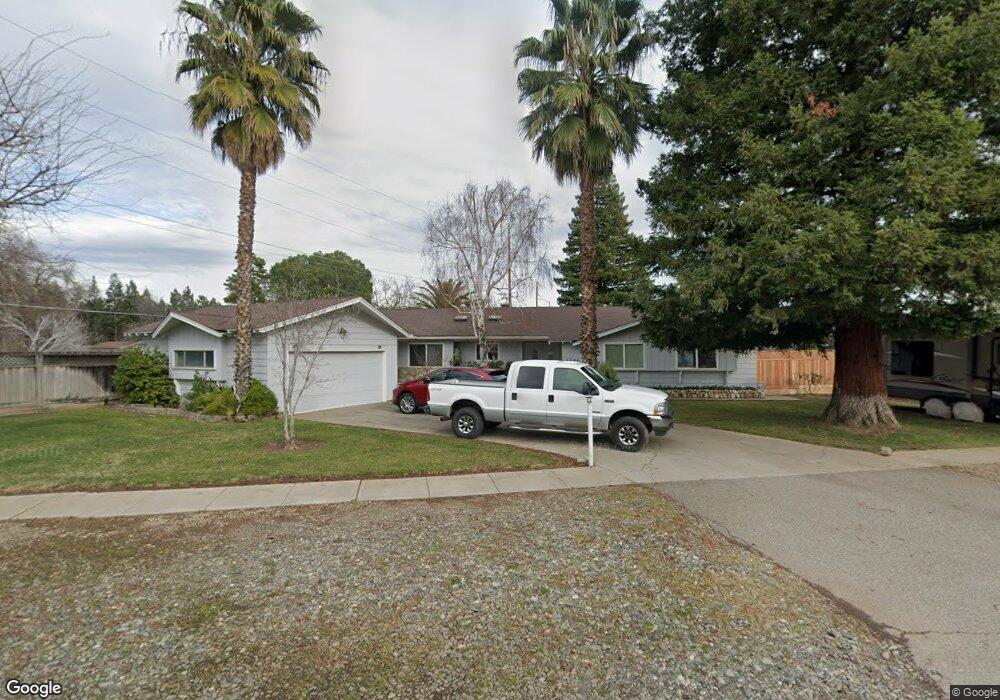
This home is located at 3484 Hackamore Ln, Chico, CA 95973 and is currently estimated at $524,542, approximately $239 per square foot. 3484 Hackamore Ln is a home located in Butte County with nearby schools including McManus (John A.) Elementary School, Bidwell Junior High School, and Pleasant Valley High School.
Ownership History
Date
Name
Owned For
Owner Type
Purchase Details
Closed on
Oct 31, 2019
Sold by
Sousa Leslie H
Bought by
Sousa Leslie Hood and Sousa Angela Jean
Current Estimated Value
Purchase Details
Closed on
Nov 13, 2001
Sold by
Barbarick Curtis J and Barbarick Lisa A
Bought by
Sousa Leslie H
Home Financials for this Owner
Home Financials are based on the most recent Mortgage that was taken out on this home.
Original Mortgage
$90,000
Interest Rate
6.67%
Purchase Details
Closed on
May 22, 1998
Sold by
Vowell Beverly A
Bought by
Barbarick Curtis J and Barbarick Lisa A
Home Financials for this Owner
Home Financials are based on the most recent Mortgage that was taken out on this home.
Original Mortgage
$158,253
Interest Rate
7.13%
Mortgage Type
VA
Create a Home Valuation Report for This Property
The Home Valuation Report is an in-depth analysis detailing your home's value as well as a comparison with similar homes in the area
Purchase History
| Date | Buyer | Sale Price | Title Company |
|---|---|---|---|
| Sousa Leslie Hood | -- | None Available | |
| Sousa Leslie H | $210,000 | Mid Valley Title & Escrow Co | |
| Sousa Leslie H | $210,000 | Mid Valley Title & Escrow Co | |
| Barbarick Curtis J | $155,500 | Fidelity National Title Co |
Source: Public Records
Mortgage History
| Date | Status | Borrower | Loan Amount |
|---|---|---|---|
| Previous Owner | Sousa Leslie H | $90,000 | |
| Previous Owner | Barbarick Curtis J | $158,253 |
Source: Public Records
Tax History
| Year | Tax Paid | Tax Assessment Tax Assessment Total Assessment is a certain percentage of the fair market value that is determined by local assessors to be the total taxable value of land and additions on the property. | Land | Improvement |
|---|---|---|---|---|
| 2025 | $3,275 | $308,728 | $94,533 | $214,195 |
| 2024 | $3,275 | $302,676 | $92,680 | $209,996 |
| 2023 | $3,235 | $296,742 | $90,863 | $205,879 |
| 2022 | $3,181 | $290,925 | $89,082 | $201,843 |
| 2021 | $3,119 | $285,222 | $87,336 | $197,886 |
| 2020 | $3,110 | $282,298 | $86,441 | $195,857 |
| 2019 | $3,057 | $276,764 | $84,747 | $192,017 |
| 2018 | $2,999 | $271,338 | $83,086 | $188,252 |
| 2017 | $2,937 | $266,018 | $81,457 | $184,561 |
| 2016 | $2,680 | $260,803 | $79,860 | $180,943 |
| 2015 | $2,679 | $256,887 | $78,661 | $178,226 |
| 2014 | -- | $251,856 | $77,121 | $174,735 |
Source: Public Records
Map
Nearby Homes
- 3424 Hackamore Ln
- 3269 Rockin M Dr
- 596 Desiree Ln
- 3156 Esplanade Unit 293
- 3156 Esplanade Unit 228
- 3156 Esplanade Unit 300
- 3156 Esplanade Unit 207
- 455 Cimarron Dr
- 3541 Vía Medio
- 3548 Via Medio
- 52 Redeemers Loop
- 3555 Via Medio Unit 175
- 375 Bainbridge Place
- 3070 Snowbird Dr
- 306 Bellamy Terrace
- 3611 Melbourne Ln
- 156 Greenfield Dr
- 294 Saint Michael Ct Unit A
- 465 Waterford Dr
- 878 Pico Place
- 3480 Hackamore Ln
- 3510 Bridle Ln
- 3476 Hackamore Ln
- 3493 Hackamore Ln
- 551 Eaton Rd
- 3489 Hackamore Ln
- 534 Eaton Rd
- 3483 Hackamore Ln
- 3497 Hackamore Ln
- 555 Eaton Rd
- 3468 Hackamore Ln
- 3477 Hackamore Ln
- 3524 Bridle Ln
- 484 Eaton Rd
- 557 Eaton Rd
- 544 Eaton Rd
- 3299 Rockin M Dr Unit 15
- 3299 Rockin M Dr
- 3471 Hackamore Ln
- 3532 Bridle Ln
Your Personal Tour Guide
Ask me questions while you tour the home.