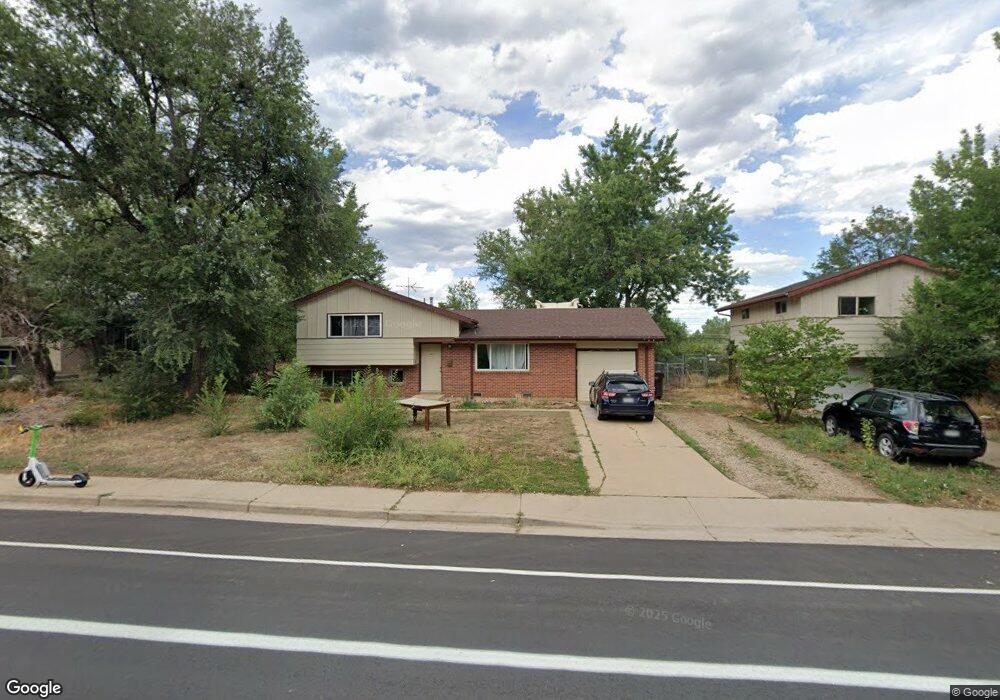
3485 Moorhead Ave Boulder, CO 80305
South Boulder NeighborhoodEstimated Value: $702,000 - $756,000
About This Home
This home is located at 3485 Moorhead Ave, Boulder, CO 80305 and is currently estimated at $724,502, approximately $808 per square foot. 3485 Moorhead Ave is a home located in Boulder County with nearby schools including Creekside Elementary School, Manhattan Middle School of the Arts & Academics, and Fairview High School.
Ownership History
We collect this data history from publicly available records. To have your information removed, we recommend requesting removal directly through your county’s website.
Purchase Details
Purchase Details
Home Financials for this Owner
Home Financials are based on the most recent Mortgage that was taken out on this home.Purchase Details
Purchase Details
Purchase Details
Purchase Details
Home Values in the Area
Average Home Value in this Area
Purchase History
We collect this data history from publicly available records. To have your information removed, we recommend requesting removal directly through your county’s website.
| Date | Buyer | Sale Price | Title Company |
|---|---|---|---|
| -- | -- | ||
| $318,000 | Land Title Guarantee Company | ||
| $112,000 | -- | ||
| -- | -- | ||
| $10,000 | -- | ||
| $51,000 | -- |
Mortgage History
We collect this data history from publicly available records. To have your information removed, we recommend requesting removal directly through your county’s website.
| Date | Status | Borrower | Loan Amount |
|---|---|---|---|
| Previous Owner | $238,500 |
Tax History
We collect this data history from publicly available records. To have your information removed, we recommend requesting removal directly through your county’s website.
| Year | Tax Paid | Tax Assessment Tax Assessment Total Assessment is a certain percentage of the fair market value that is determined by local assessors to be the total taxable value of land and additions on the property. | Land | Improvement |
|---|---|---|---|---|
| 2026 | $4,211 | $47,124 | $34,218 | $12,906 |
| 2025 | $4,211 | $47,124 | $34,218 | $12,906 |
| 2024 | $4,178 | $43,313 | $31,450 | $11,863 |
| 2023 | $4,103 | $46,645 | $37,192 | $13,139 |
| 2022 | $3,820 | $40,331 | $27,828 | $12,503 |
| 2021 | $3,646 | $41,492 | $28,629 | $12,863 |
| 2020 | $3,336 | $38,324 | $22,451 | $15,873 |
| 2019 | $3,285 | $38,324 | $22,451 | $15,873 |
| 2018 | $2,793 | $32,220 | $19,152 | $13,068 |
| 2017 | $2,706 | $35,621 | $21,174 | $14,447 |
| 2016 | $2,762 | $31,911 | $14,487 | $17,424 |
| 2015 | $2,616 | $24,621 | $10,826 | $13,795 |
| 2014 | $2,070 | $24,621 | $10,826 | $13,795 |
Map
- 3664 Chase Ct
- 330 32nd St
- 700 33rd St
- 735 32nd St
- 340 28th St
- 265 S 39th St
- 735 38th St
- 325 27th St
- 310 S 40th St
- 350 Bates Ave
- 805 29th St Unit 452
- 805 29th St Unit 262
- 805 29th St Unit 301
- 805 29th St Unit 202
- 805 29th St Unit 152
- 805 29th St Unit 459
- 805 29th St Unit 404
- 3090 Aurora Ave
- 430 S 42nd St
- 2955 Stanford Ave
- 3465 Moorhead Ave
- 3445 Moorhead Ave
- 3425 Moorhead Ave
- 3495 Moorhead Ave
- 3480 Ash Ave
- 3405 Moorhead Ave
- 15 S 35th St
- 3470 Ash Ave
- 3398 Moorhead Ave
- 3395 Moorhead Ave
- 3525 Moorhead Ave
- 3485 Ash Ave
- 3460 Ash Ave
- 3396 Moorhead Ave
- 3385 Moorhead Ave
- 10 S 35th St
- 35 S 35th St
- 3465 Ash Ave
- 3390 Moorhead Ave
- 20 S 35th St
Ask me questions while you tour the home.