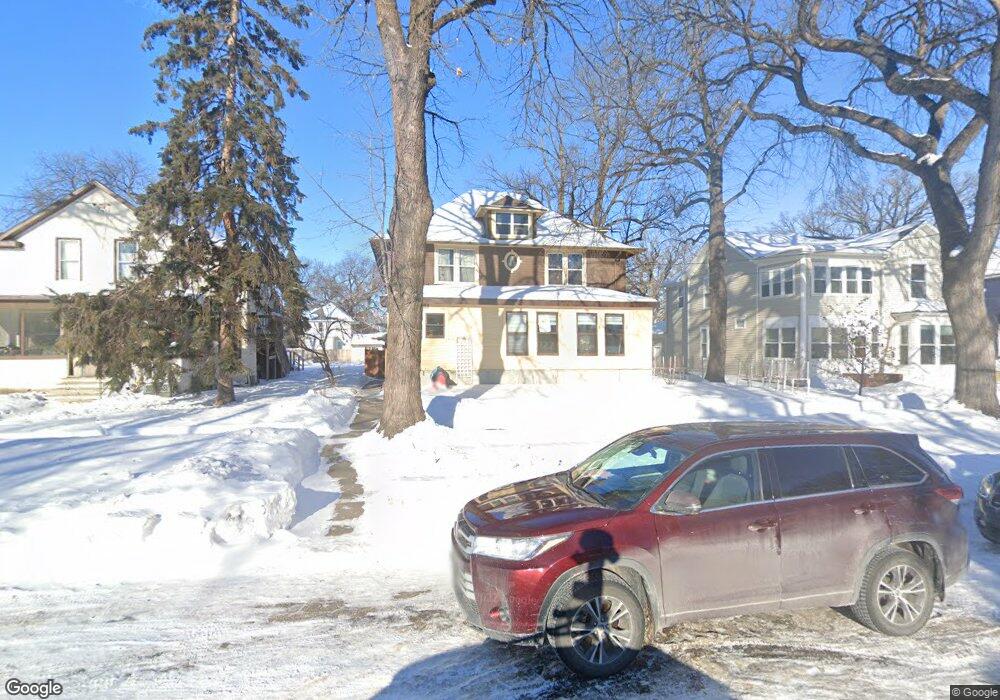
349 9th Ave S Fargo, ND 58103
Hawthorne NeighborhoodEstimated Value: $370,000 - $477,000
Studio
--
Bath
3,024
Sq Ft
$136/Sq Ft
Est. Value
About This Home
This home is located at 349 9th Ave S, Fargo, ND 58103 and is currently estimated at $410,975, approximately $135 per square foot. 349 9th Ave S is a home with nearby schools including Clara Barton Elementary School, Ben Franklin Middle School, and South High School.
Ownership History
Date
Name
Owned For
Owner Type
Purchase Details
Closed on
Nov 15, 2013
Sold by
Huff Charles M and Huff Charles Myron
Bought by
Kohanowski Shaun Paul and Kohanowski Jessica A
Current Estimated Value
Home Financials for this Owner
Home Financials are based on the most recent Mortgage that was taken out on this home.
Original Mortgage
$169,900
Outstanding Balance
$126,703
Interest Rate
4.23%
Mortgage Type
VA
Estimated Equity
$284,272
Purchase Details
Closed on
Sep 10, 2009
Sold by
Birkholtz Pamala Sue and Birkholtz Huff Pamal Sue
Bought by
Huff Charles Myron
Create a Home Valuation Report for This Property
The Home Valuation Report is an in-depth analysis detailing your home's value as well as a comparison with similar homes in the area
Home Values in the Area
Average Home Value in this Area
Purchase History
| Date | Buyer | Sale Price | Title Company |
|---|---|---|---|
| Kohanowski Shaun Paul | $169,900 | Title Co | |
| Huff Charles Myron | -- | -- |
Source: Public Records
Mortgage History
| Date | Status | Borrower | Loan Amount |
|---|---|---|---|
| Open | Kohanowski Shaun Paul | $169,900 |
Source: Public Records
Tax History
| Year | Tax Paid | Tax Assessment Tax Assessment Total Assessment is a certain percentage of the fair market value that is determined by local assessors to be the total taxable value of land and additions on the property. | Land | Improvement |
|---|---|---|---|---|
| 2024 | $5,769 | $231,850 | $20,050 | $211,800 |
| 2023 | $6,236 | $231,850 | $20,050 | $211,800 |
| 2022 | $5,739 | $209,750 | $20,050 | $189,700 |
| 2021 | $5,369 | $199,750 | $20,050 | $179,700 |
| 2020 | $5,317 | $199,750 | $20,050 | $179,700 |
| 2019 | $1,850 | $70,300 | $11,900 | $58,400 |
| 2018 | $1,826 | $70,300 | $11,900 | $58,400 |
| 2017 | $1,760 | $68,500 | $11,900 | $56,600 |
| 2016 | $1,380 | $58,550 | $11,900 | $46,650 |
| 2015 | $1,260 | $50,150 | $8,150 | $42,000 |
| 2014 | $1,461 | $51,000 | $9,000 | $42,000 |
| 2013 | $1,462 | $51,000 | $9,000 | $42,000 |
Source: Public Records
Map
Nearby Homes
- 326 10th Ave S Unit 2
- 420 6th Ave S Unit 303
- 1020 6th St S
- 1010 River Dr
- 605 7th St S Unit 2
- 1311 5th St S
- 502 8th St S Unit 5
- 502 8th St S Unit 1
- 502 8th St S Unit 2
- 502 8th St S Unit 4
- 1119 Elm St S
- 505 8th St S
- 817 9th St S
- 804 10th St S Unit A4
- 812 10th St S Unit B9
- 1348 6th St S
- 220 8th St S Unit B2
- 220 8th St S Unit D4
- 601 10th St S
- 1208 2nd St S
Your Personal Tour Guide
Ask me questions while you tour the home.