349 Atlantic Ave Fairfield, CA 94533
Estimated Value: $352,000 - $497,000
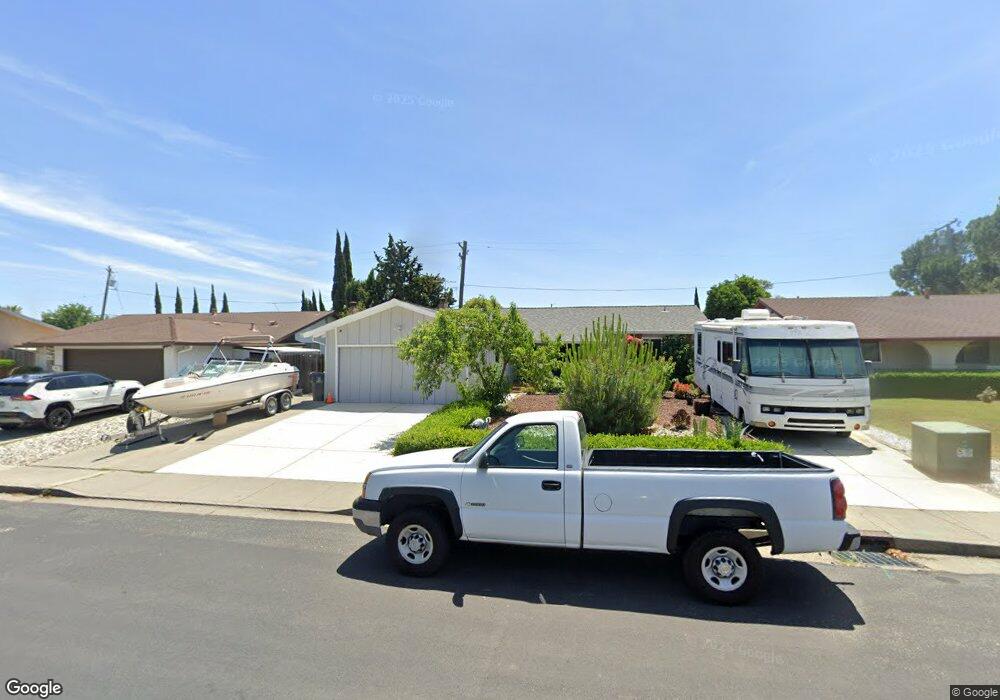
About This Home
This home is located at 349 Atlantic Ave, Fairfield, CA 94533 and is currently estimated at $458,410, approximately $339 per square foot. 349 Atlantic Ave is a home located in Solano County with nearby schools including Dover Elementary School, Grange Middle School, and Fairfield High School.
Ownership History
We collect this data history from publicly available records. To have your information removed, we recommend requesting removal directly through your county’s website.
Purchase Details
Purchase Details
Home Financials for this Owner
Home Financials are based on the most recent Mortgage that was taken out on this home.Purchase Details
Home Financials for this Owner
Home Financials are based on the most recent Mortgage that was taken out on this home.Home Values in the Area
Average Home Value in this Area
Purchase History
We collect this data history from publicly available records. To have your information removed, we recommend requesting removal directly through your county’s website.
| Date | Buyer | Sale Price | Title Company |
|---|---|---|---|
| -- | -- | ||
| -- | Lenders Choice Title | ||
| $125,000 | Fidelity National Title Co |
Mortgage History
We collect this data history from publicly available records. To have your information removed, we recommend requesting removal directly through your county’s website.
| Date | Status | Borrower | Loan Amount |
|---|---|---|---|
| Previous Owner | $288,000 | ||
| Previous Owner | $125,000 |
Tax History
We collect this data history from publicly available records. To have your information removed, we recommend requesting removal directly through your county’s website.
| Year | Tax Paid | Tax Assessment Tax Assessment Total Assessment is a certain percentage of the fair market value that is determined by local assessors to be the total taxable value of land and additions on the property. | Land | Improvement |
|---|---|---|---|---|
| 2025 | $2,156 | $198,417 | $62,703 | $135,714 |
| 2024 | $2,156 | $194,527 | $61,474 | $133,053 |
| 2023 | $2,089 | $190,714 | $60,271 | $130,443 |
| 2022 | $2,062 | $186,976 | $59,090 | $127,886 |
| 2021 | $2,040 | $183,311 | $57,932 | $125,379 |
| 2020 | $1,992 | $181,432 | $57,338 | $124,094 |
| 2019 | $1,942 | $177,875 | $56,214 | $121,661 |
| 2018 | $2,003 | $174,388 | $55,112 | $119,276 |
| 2017 | $1,909 | $170,970 | $54,032 | $116,938 |
| 2016 | $1,887 | $167,619 | $52,973 | $114,646 |
| 2015 | $1,761 | $165,102 | $52,178 | $112,924 |
| 2014 | $1,744 | $161,868 | $51,156 | $110,712 |
Map
- 2680 Marigold Dr
- 278 Jasmine St
- 2698 Laurel Dr
- 209 Begonia Blvd
- 15 Dali Ct
- 2731 Orchid St
- 2289 Rutland Ct
- 41 Goya Dr
- 102 Goya Dr
- 45 Goya Dr
- 2256 Dorset Ln
- 50 Anza Ct
- 2260 Nottingham Dr
- 2275 Cambridge Dr
- 14 Balboa Ct
- 2915 N Texas St Unit 153
- 2915 N Texas St Unit 148
- 74 Anza Ct
- 937 Pacific Ave
- 2973 Orchid St
Ask me questions while you tour the home.