349 East St Easthampton, MA 01027
Estimated Value: $381,949 - $474,000
4
Beds
2
Baths
1,486
Sq Ft
$289/Sq Ft
Est. Value
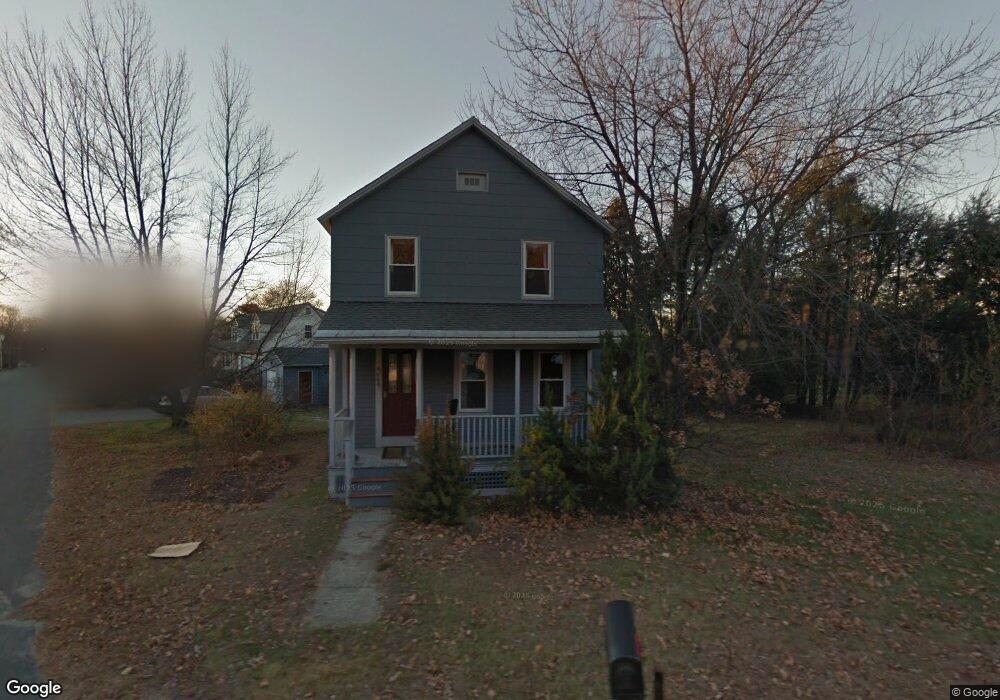
About This Home
This home is located at 349 East St, Easthampton, MA 01027 and is currently estimated at $429,987, approximately $289 per square foot. 349 East St is a home located in Hampshire County with nearby schools including Easthampton High School, Hilltown Cooperative Charter Public School, and Tri-County Schools.
Ownership History
Date
Name
Owned For
Owner Type
Purchase Details
Closed on
Sep 1, 2017
Sold by
Capistran Susan M
Bought by
Thomas Nia D
Current Estimated Value
Home Financials for this Owner
Home Financials are based on the most recent Mortgage that was taken out on this home.
Original Mortgage
$175,200
Outstanding Balance
$146,540
Interest Rate
3.96%
Mortgage Type
New Conventional
Estimated Equity
$283,447
Purchase Details
Closed on
Aug 24, 2001
Sold by
Craig Rt
Bought by
Capistran Conrad J and Capistran Susan M
Home Financials for this Owner
Home Financials are based on the most recent Mortgage that was taken out on this home.
Original Mortgage
$121,125
Interest Rate
7.21%
Mortgage Type
Purchase Money Mortgage
Create a Home Valuation Report for This Property
The Home Valuation Report is an in-depth analysis detailing your home's value as well as a comparison with similar homes in the area
Home Values in the Area
Average Home Value in this Area
Purchase History
| Date | Buyer | Sale Price | Title Company |
|---|---|---|---|
| Thomas Nia D | $219,000 | -- | |
| Capistran Conrad J | $127,500 | -- |
Source: Public Records
Mortgage History
| Date | Status | Borrower | Loan Amount |
|---|---|---|---|
| Open | Thomas Nia D | $175,200 | |
| Previous Owner | Capistran Conrad J | $112,000 | |
| Previous Owner | Capistran Conrad J | $122,620 | |
| Previous Owner | Capistran Conrad J | $121,125 |
Source: Public Records
Tax History Compared to Growth
Tax History
| Year | Tax Paid | Tax Assessment Tax Assessment Total Assessment is a certain percentage of the fair market value that is determined by local assessors to be the total taxable value of land and additions on the property. | Land | Improvement |
|---|---|---|---|---|
| 2025 | $4,260 | $311,600 | $110,800 | $200,800 |
| 2024 | $4,111 | $303,200 | $107,500 | $195,700 |
| 2023 | $3,139 | $214,300 | $85,300 | $129,000 |
| 2022 | $3,542 | $214,300 | $85,300 | $129,000 |
| 2021 | $3,871 | $220,700 | $85,300 | $135,400 |
| 2020 | $3,806 | $214,300 | $85,300 | $129,000 |
| 2019 | $3,135 | $202,800 | $85,300 | $117,500 |
| 2018 | $3,024 | $189,000 | $80,500 | $108,500 |
| 2017 | $2,947 | $181,800 | $77,200 | $104,600 |
| 2016 | $2,814 | $180,500 | $77,200 | $103,300 |
| 2015 | $2,735 | $180,500 | $77,200 | $103,300 |
Source: Public Records
Map
Nearby Homes
- 108 Parsons St
- 2 Clinton St
- 98 Everett St
- 52-54 Everett St
- 33 Knipfer Ave
- 12 Glen Cove Place Unit B
- 10 Glen Cove Place Unit A
- 78 Holyoke St
- 19 Nicols Way Unit 19
- 52 Williston Ave
- 5 Lownds Ave
- 125 Park St
- 38 West St
- 41 South St Unit 11
- 6 S St & Abutting Lots
- 33 Howard Ave
- 385 Main St
- M143 &152 Glendale St
- 457 Northampton St
- Lot 1 Edgewater Ln