349 N Main St Salem, NH 03079
Arlington Pond NeighborhoodEstimated Value: $502,432 - $558,000
2
Beds
1
Bath
854
Sq Ft
$619/Sq Ft
Est. Value
About This Home
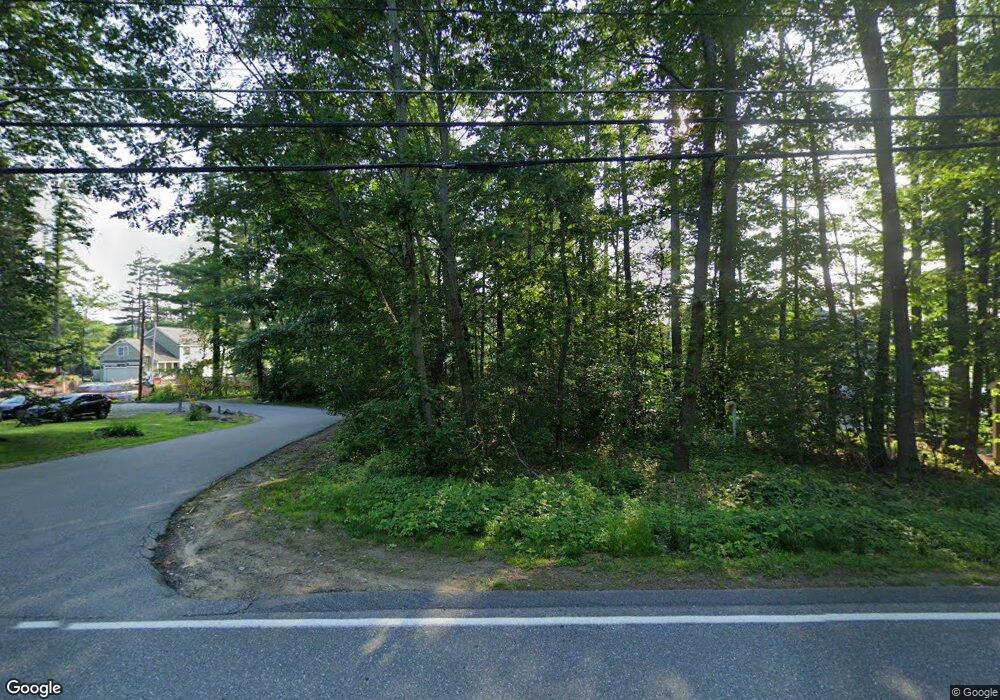
This home is located at 349 N Main St, Salem, NH 03079 and is currently estimated at $528,858, approximately $619 per square foot. 349 N Main St is a home located in Rockingham County with nearby schools including North Salem Elementary School, Woodbury School, and Salem High School.
Ownership History
Date
Name
Owned For
Owner Type
Purchase Details
Closed on
May 27, 2015
Sold by
Rosenberg Mark
Bought by
Mark Rosenberg Ret
Current Estimated Value
Purchase Details
Closed on
Nov 25, 2014
Sold by
Mark Resenberg Ret
Bought by
Rosenberg Mark
Purchase Details
Closed on
Sep 27, 2002
Sold by
Parker Donn M and Parker Lorette M
Bought by
Rosenberg Mark A
Home Financials for this Owner
Home Financials are based on the most recent Mortgage that was taken out on this home.
Original Mortgage
$50,000
Interest Rate
6.25%
Mortgage Type
Purchase Money Mortgage
Create a Home Valuation Report for This Property
The Home Valuation Report is an in-depth analysis detailing your home's value as well as a comparison with similar homes in the area
Home Values in the Area
Average Home Value in this Area
Purchase History
| Date | Buyer | Sale Price | Title Company |
|---|---|---|---|
| Mark Rosenberg Ret | -- | -- | |
| Rosenberg Mark | -- | -- | |
| Rosenberg Mark A | $150,000 | -- |
Source: Public Records
Mortgage History
| Date | Status | Borrower | Loan Amount |
|---|---|---|---|
| Previous Owner | Rosenberg Mark A | $50,000 |
Source: Public Records
Tax History Compared to Growth
Tax History
| Year | Tax Paid | Tax Assessment Tax Assessment Total Assessment is a certain percentage of the fair market value that is determined by local assessors to be the total taxable value of land and additions on the property. | Land | Improvement |
|---|---|---|---|---|
| 2024 | $8,531 | $484,700 | $409,300 | $75,400 |
| 2023 | $8,221 | $484,700 | $409,300 | $75,400 |
| 2022 | $7,779 | $484,700 | $409,300 | $75,400 |
| 2021 | $7,746 | $484,700 | $409,300 | $75,400 |
| 2020 | $7,751 | $352,000 | $292,500 | $59,500 |
| 2019 | $7,737 | $352,000 | $292,500 | $59,500 |
| 2018 | $7,607 | $352,000 | $292,500 | $59,500 |
| 2017 | $7,336 | $352,000 | $292,500 | $59,500 |
| 2016 | $7,191 | $352,000 | $292,500 | $59,500 |
| 2015 | $5,054 | $236,300 | $187,900 | $48,400 |
| 2014 | $4,913 | $236,300 | $187,900 | $48,400 |
| 2013 | $4,835 | $236,300 | $187,900 | $48,400 |
Source: Public Records
Map
Nearby Homes