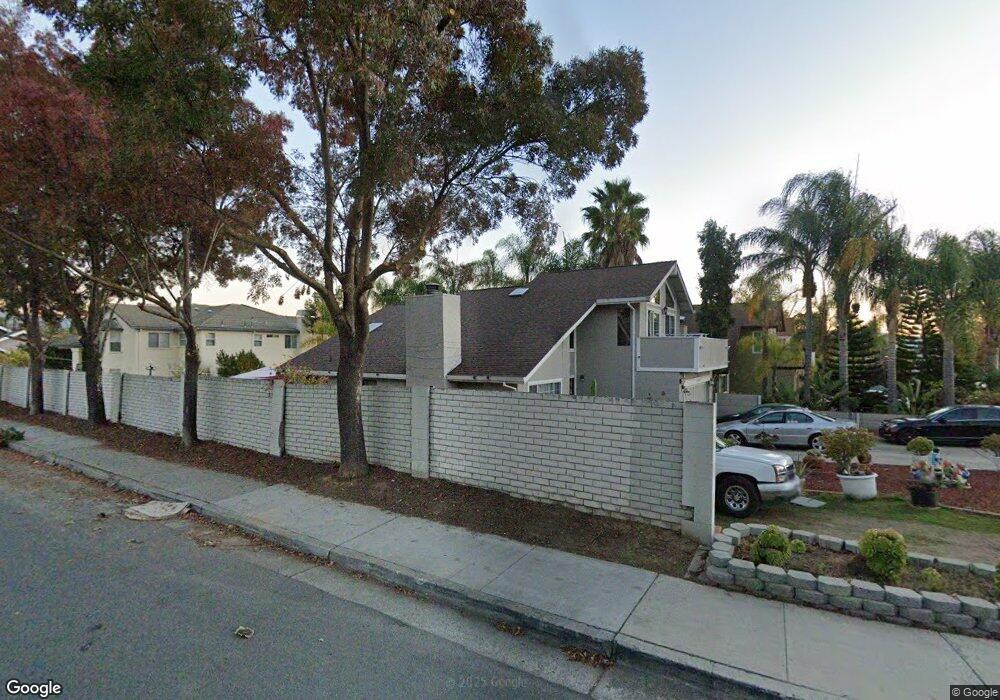
3490 Neves Way San Jose, CA 95127
Alum Rock NeighborhoodEstimated Value: $1,247,199 - $1,395,000
4
Beds
3
Baths
1,823
Sq Ft
$716/Sq Ft
Est. Value
About This Home
This home is located at 3490 Neves Way, San Jose, CA 95127 and is currently estimated at $1,305,300, approximately $716 per square foot. 3490 Neves Way is a home located in Santa Clara County with nearby schools including Horace Cureton Elementary School, Joseph George Middle School, and James Lick High School.
Ownership History
Date
Name
Owned For
Owner Type
Purchase Details
Closed on
Oct 26, 2020
Sold by
Rangel Juan Carlos and Garcia Flora Cepeda
Bought by
Rangel Juan Carlos
Current Estimated Value
Home Financials for this Owner
Home Financials are based on the most recent Mortgage that was taken out on this home.
Original Mortgage
$427,600
Outstanding Balance
$380,503
Interest Rate
2.8%
Mortgage Type
New Conventional
Estimated Equity
$924,797
Purchase Details
Closed on
Oct 16, 2006
Sold by
Rangel Sanchez Felipe and Rangel Jose A
Bought by
Rangel Juan C
Home Financials for this Owner
Home Financials are based on the most recent Mortgage that was taken out on this home.
Original Mortgage
$487,500
Interest Rate
6.39%
Mortgage Type
Stand Alone First
Purchase Details
Closed on
May 1, 1998
Sold by
Dela Torre Rick J
Bought by
Rangel Juan C and Rangel Sanchez Felipe
Home Financials for this Owner
Home Financials are based on the most recent Mortgage that was taken out on this home.
Original Mortgage
$307,800
Interest Rate
7.5%
Create a Home Valuation Report for This Property
The Home Valuation Report is an in-depth analysis detailing your home's value as well as a comparison with similar homes in the area
Home Values in the Area
Average Home Value in this Area
Purchase History
| Date | Buyer | Sale Price | Title Company |
|---|---|---|---|
| Rangel Juan Carlos | -- | Stewart | |
| Rangel Juan C | $487,500 | Chicago Title Company | |
| Rangel Juan C | $324,000 | American Title Co |
Source: Public Records
Mortgage History
| Date | Status | Borrower | Loan Amount |
|---|---|---|---|
| Open | Rangel Juan Carlos | $427,600 | |
| Closed | Rangel Juan C | $487,500 | |
| Previous Owner | Rangel Juan C | $307,800 |
Source: Public Records
Tax History Compared to Growth
Tax History
| Year | Tax Paid | Tax Assessment Tax Assessment Total Assessment is a certain percentage of the fair market value that is determined by local assessors to be the total taxable value of land and additions on the property. | Land | Improvement |
|---|---|---|---|---|
| 2025 | $13,292 | $917,946 | $641,722 | $276,224 |
| 2024 | $13,292 | $899,948 | $629,140 | $270,808 |
| 2023 | $13,054 | $882,303 | $616,804 | $265,499 |
| 2022 | $12,804 | $865,004 | $604,710 | $260,294 |
| 2021 | $12,385 | $848,044 | $592,853 | $255,191 |
| 2020 | $12,178 | $839,350 | $586,775 | $252,575 |
| 2019 | $11,857 | $822,893 | $575,270 | $247,623 |
| 2018 | $11,718 | $806,759 | $563,991 | $242,768 |
| 2017 | $10,945 | $727,600 | $508,600 | $219,000 |
| 2016 | $9,900 | $680,000 | $475,300 | $204,700 |
| 2015 | $10,498 | $633,000 | $442,500 | $190,500 |
| 2014 | $9,177 | $554,000 | $387,300 | $166,700 |
Source: Public Records
Map
Nearby Homes
- 14830 Corralitos Ln
- 58 Clareview Ave
- 0000 Altadena Ln
- 75 S Cragmont Ave
- 10741 Ridgeview Ave
- 0 Gordon Blvd Unit FR25034343
- 0 Gordon Blvd Unit 625465
- 0 Gordon Blvd Unit 231524
- 0 Gordon Blvd Unit SR23111317
- 10745 Ridgeview Way
- 366 Cureton Place
- 186 Mountain View Ave
- 681 Heirloom Ct
- 80 Pickford Ave
- 14545 Jerilyn Dr
- 3405 E Hills Dr
- 207 N Claremont Ave
- 14990 Garcal Dr
- 274 Vista Ave
- 801 Fleming Ave
- 3484 Neves Way
- 153 Fleming Ave
- 3478 Neves Way
- 200 Fleming Ave
- 218 Fleming Ave
- 194 Fleming Ave
- 3491 Neves Way
- 264 Clareview Ct
- 268 Clareview Ct
- 3485 Neves Way
- 260 Clareview Ct
- 190 Fleming Ct
- 3428 Neves Way
- 3434 Neves Way
- 3479 Neves Way
- 204 Fleming Ave
- 3422 Neves Way
- 186 Fleming Ct
- 3473 Neves Way
- 256 Clareview Ct