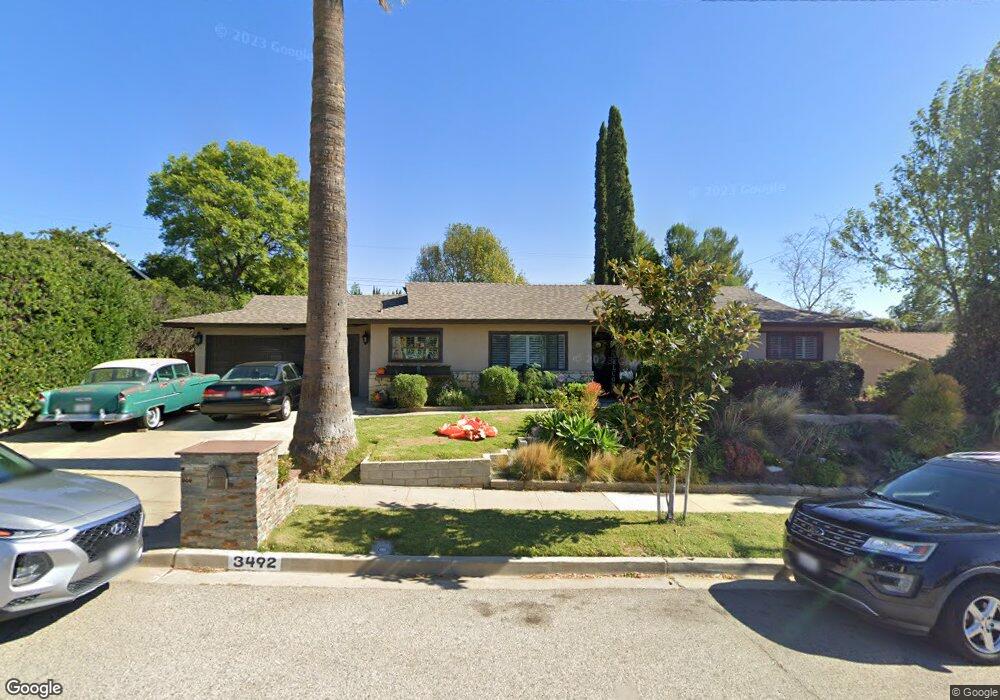
3492 Austin Ave Simi Valley, CA 93063
East Simi Valley NeighborhoodEstimated Value: $845,000 - $886,000
3
Beds
2
Baths
1,434
Sq Ft
$606/Sq Ft
Est. Value
About This Home
This home is located at 3492 Austin Ave, Simi Valley, CA 93063 and is currently estimated at $869,267, approximately $606 per square foot. 3492 Austin Ave is a home located in Ventura County with nearby schools including Big Springs Elementary School, Valley View Middle School, and Simi Valley High School.
Ownership History
Date
Name
Owned For
Owner Type
Purchase Details
Closed on
May 20, 2008
Sold by
Petrisca Mary Ann
Bought by
Deazevedo Eric R and Deazevedo Azucena M
Current Estimated Value
Home Financials for this Owner
Home Financials are based on the most recent Mortgage that was taken out on this home.
Original Mortgage
$390,150
Interest Rate
6.07%
Mortgage Type
Purchase Money Mortgage
Purchase Details
Closed on
Jan 25, 2000
Sold by
Thomson Scott A and Thomson Linda M
Bought by
Petrisca Mary Ann
Home Financials for this Owner
Home Financials are based on the most recent Mortgage that was taken out on this home.
Original Mortgage
$185,600
Interest Rate
3.95%
Purchase Details
Closed on
Nov 5, 1993
Sold by
Olson Derrick M and Olson Ramona R
Bought by
Thomson Scott Alexander and Thomson Linda Mathiesen
Home Financials for this Owner
Home Financials are based on the most recent Mortgage that was taken out on this home.
Original Mortgage
$184,000
Interest Rate
7.38%
Mortgage Type
Assumption
Create a Home Valuation Report for This Property
The Home Valuation Report is an in-depth analysis detailing your home's value as well as a comparison with similar homes in the area
Home Values in the Area
Average Home Value in this Area
Purchase History
| Date | Buyer | Sale Price | Title Company |
|---|---|---|---|
| Deazevedo Eric R | $427,500 | Fidelity Van Nuys | |
| Petrisca Mary Ann | $232,000 | First American Title Ins Co | |
| Thomson Scott Alexander | $184,000 | Gateway Title Co |
Source: Public Records
Mortgage History
| Date | Status | Borrower | Loan Amount |
|---|---|---|---|
| Previous Owner | Deazevedo Eric R | $390,150 | |
| Previous Owner | Petrisca Mary Ann | $185,600 | |
| Previous Owner | Thomson Scott Alexander | $184,000 |
Source: Public Records
Tax History Compared to Growth
Tax History
| Year | Tax Paid | Tax Assessment Tax Assessment Total Assessment is a certain percentage of the fair market value that is determined by local assessors to be the total taxable value of land and additions on the property. | Land | Improvement |
|---|---|---|---|---|
| 2025 | $6,658 | $550,502 | $357,992 | $192,510 |
| 2024 | $6,658 | $539,708 | $350,972 | $188,736 |
| 2023 | $6,261 | $529,126 | $344,090 | $185,036 |
| 2022 | $6,240 | $518,751 | $337,343 | $181,408 |
| 2021 | $6,197 | $508,580 | $330,729 | $177,851 |
| 2020 | $6,071 | $503,367 | $327,339 | $176,028 |
| 2019 | $5,796 | $493,498 | $320,921 | $172,577 |
| 2018 | $5,749 | $483,823 | $314,629 | $169,194 |
| 2017 | $5,623 | $474,337 | $308,460 | $165,877 |
| 2016 | $5,371 | $465,037 | $302,412 | $162,625 |
| 2015 | $5,260 | $458,053 | $297,870 | $160,183 |
| 2014 | $5,188 | $449,083 | $292,036 | $157,047 |
Source: Public Records
Map
Nearby Homes
- 4699 Summit Ave
- 4687 Summit Ave
- 4691 Summit Ave
- 4679 Summit Ave
- 4683 Summit Ave
- 3762 Prairie Ridge Ct
- 3175 Corpus Christi St
- 3194 Granville Ave
- 4984 Corral St
- 5019 Corral St
- 3581 Rachael Ave
- 3586 Lathrop Ave
- 3005 Mineral Wells Dr
- 2945 Dalhart Ave
- 4676 Kleberg St
- 4448 Lubbock Dr Unit C
- 4581 Lubbock Dr
- 3484 Austin Ave
- 3508 Austin Ave
- 3493 Austin Ave
- 3509 Austin Ave
- 3476 Austin Ave
- 3530 Austin Ave
- 3485 Austin Ave
- 3531 Austin Ave
- 3477 Austin Ave
- 3494 Galveston Ave
- 3508 Galveston Ave
- 3468 Austin Ave
- 3552 Austin Ave
- 3553 Austin Ave
- 3488 Galveston Ave
- 3530 Galveston Ave
- 3488 N Galveston Ave
- 3469 Austin Ave
- 3476 Galveston Ave
- 3552 Galveston Ave