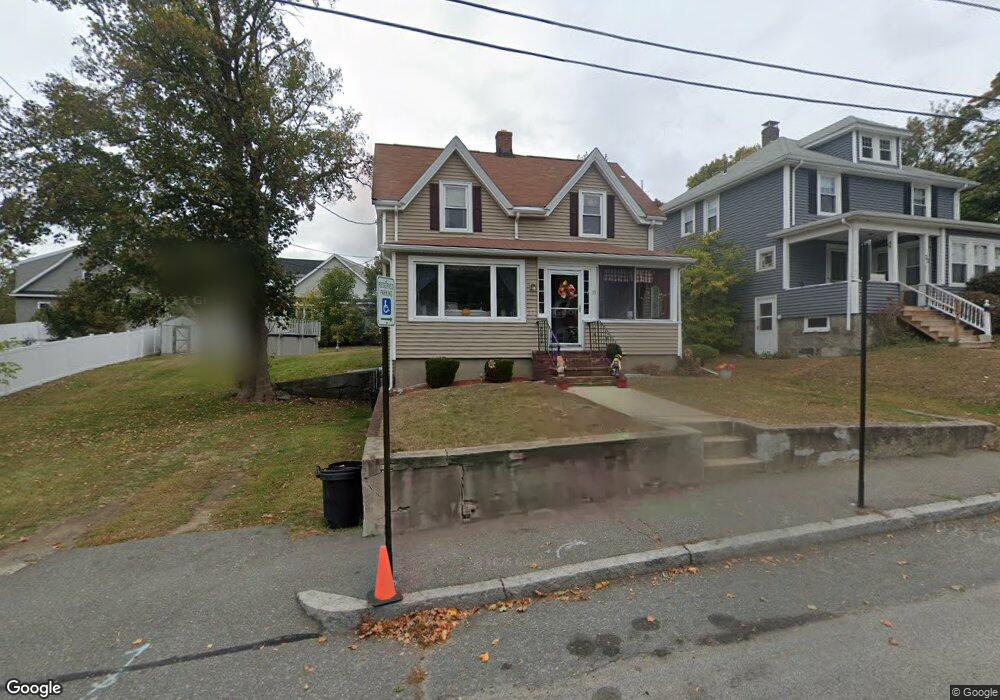
35 Carruth St Quincy, MA 02170
Quincy Center NeighborhoodEstimated Value: $491,000 - $652,669
3
Beds
1
Bath
1,069
Sq Ft
$551/Sq Ft
Est. Value
About This Home
This home is located at 35 Carruth St, Quincy, MA 02170 and is currently estimated at $589,167, approximately $551 per square foot. 35 Carruth St is a home located in Norfolk County with nearby schools including Merrymount Elementary School, Central Middle School, and North Quincy High School.
Ownership History
Date
Name
Owned For
Owner Type
Purchase Details
Closed on
Jul 23, 2021
Sold by
Lord Robert B and Lord Denise M
Bought by
Lord Ft
Current Estimated Value
Purchase Details
Closed on
Oct 20, 1976
Bought by
Lord Robert B
Create a Home Valuation Report for This Property
The Home Valuation Report is an in-depth analysis detailing your home's value as well as a comparison with similar homes in the area
Home Values in the Area
Average Home Value in this Area
Purchase History
| Date | Buyer | Sale Price | Title Company |
|---|---|---|---|
| Lord Ft | -- | None Available | |
| Lord Robert B | -- | -- |
Source: Public Records
Mortgage History
| Date | Status | Borrower | Loan Amount |
|---|---|---|---|
| Previous Owner | Lord Robert B | $17,000 | |
| Previous Owner | Lord Robert B | $10,000 |
Source: Public Records
Tax History
| Year | Tax Paid | Tax Assessment Tax Assessment Total Assessment is a certain percentage of the fair market value that is determined by local assessors to be the total taxable value of land and additions on the property. | Land | Improvement |
|---|---|---|---|---|
| 2025 | $7,060 | $612,300 | $389,100 | $223,200 |
| 2024 | $6,799 | $603,300 | $389,100 | $214,200 |
| 2023 | $6,384 | $573,600 | $370,900 | $202,700 |
| 2022 | $5,904 | $492,800 | $297,900 | $194,900 |
| 2021 | $5,708 | $470,200 | $297,900 | $172,300 |
| 2020 | $5,610 | $451,300 | $297,900 | $153,400 |
| 2019 | $5,395 | $429,900 | $278,800 | $151,100 |
| 2018 | $5,201 | $389,900 | $254,000 | $135,900 |
| 2017 | $5,383 | $379,900 | $254,000 | $125,900 |
| 2016 | $5,022 | $349,700 | $231,400 | $118,300 |
| 2015 | $4,659 | $319,100 | $210,900 | $108,200 |
| 2014 | $4,350 | $292,700 | $201,100 | $91,600 |
Source: Public Records
Map
Nearby Homes
- 1025 Hancock St Unit 6J
- 1025 Hancock St Unit 2K
- 10 Presidents Ln Unit 10
- 72 Oakland Ave
- 22 Newton Ave
- 20 Whitney Rd Unit 1
- 20 Whitney Rd Unit 6
- 20 Whitney Rd Unit 2
- 28 Edgewood Cir
- 144 Kemper St
- 195 Thomas Burgin Pkwy Unit 212
- 195 Thomas Burgin Pkwy Unit 301
- 1 Cityview Ln Unit 506
- 1 Cityview Ln Unit 709
- 1 Cityview Ln Unit 707
- 105 Sea St Unit 105
- 105 Sea St Unit 102
- 59 Spear St Unit 201
- 59 Spear St Unit 302
- 59 Spear St Unit 402
- 33 Carruth St
- 29 Carruth St
- 41 Carruth St
- 42 Gilmore St
- 38 Gilmore St Unit D
- 38 Gilmore St
- 42 Gilmore St Unit A
- 42 Gilmore St Unit G
- 42 Gilmore St Unit D
- 42 Gilmore St Unit F
- 42 Gilmore St Unit E
- 32 Gilmore St
- 38 Carruth St
- 44 Carruth St
- 34 Carruth St
- 23 Carruth St
- 30 Carruth St
- 30 Gilmore St Unit 30
- 28 Gilmore St
- 28 Gilmore St Unit 1
Your Personal Tour Guide
Ask me questions while you tour the home.