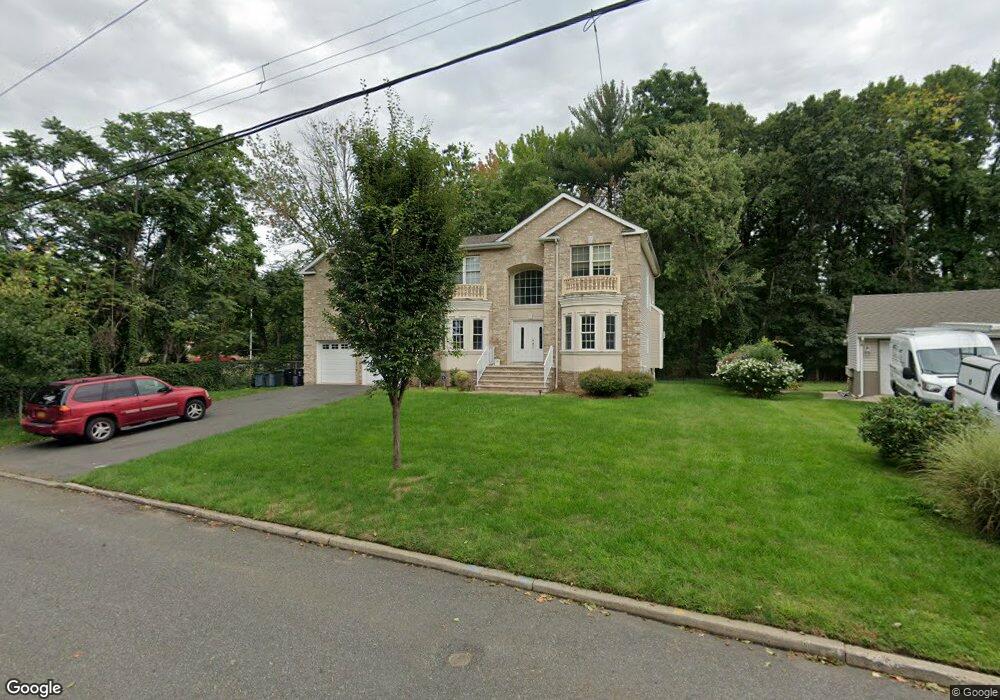
35 Circle Dr Paramus, NJ 07652
Estimated Value: $1,508,000 - $1,736,000
Studio
--
Bath
3,752
Sq Ft
$435/Sq Ft
Est. Value
About This Home
This home is located at 35 Circle Dr, Paramus, NJ 07652 and is currently estimated at $1,633,971, approximately $435 per square foot. 35 Circle Dr is a home located in Bergen County with nearby schools including Paramus High School, Ben Porat Yosef, and St. Peter Academy.
Ownership History
Date
Name
Owned For
Owner Type
Purchase Details
Closed on
Jul 2, 2007
Current Estimated Value
Home Financials for this Owner
Home Financials are based on the most recent Mortgage that was taken out on this home.
Original Mortgage
$700,000
Outstanding Balance
$435,003
Interest Rate
6.39%
Mortgage Type
New Conventional
Estimated Equity
$1,198,968
Purchase Details
Closed on
Sep 29, 2005
Sold by
Riordan Thomas
Bought by
Laferlita Salvatore and Cosentino Salvatore
Home Financials for this Owner
Home Financials are based on the most recent Mortgage that was taken out on this home.
Original Mortgage
$392,000
Interest Rate
5.79%
Purchase Details
Closed on
Jul 19, 2005
Sold by
Snell Peter
Bought by
Riordan Thomas and Falvey Patrick
Home Financials for this Owner
Home Financials are based on the most recent Mortgage that was taken out on this home.
Original Mortgage
$332,000
Interest Rate
5.66%
Purchase Details
Closed on
Aug 11, 1997
Sold by
Snell Paul E and Snell Hazel V
Bought by
Snell Peter
Create a Home Valuation Report for This Property
The Home Valuation Report is an in-depth analysis detailing your home's value as well as a comparison with similar homes in the area
Home Values in the Area
Average Home Value in this Area
Purchase History
| Date | Buyer | Sale Price | Title Company |
|---|---|---|---|
| -- | $875,000 | -- | |
| Perry Ketih | $675,000 | -- | |
| Laferlita Salvatore | $49,000 | -- | |
| Riordan Thomas | $415,000 | -- | |
| Snell Peter | -- | -- |
Source: Public Records
Mortgage History
| Date | Status | Borrower | Loan Amount |
|---|---|---|---|
| Open | Perry Ketih | $700,000 | |
| Closed | -- | $700,000 | |
| Previous Owner | Laferlita Salvatore | $392,000 | |
| Previous Owner | Riordan Thomas | $332,000 |
Source: Public Records
Tax History
| Year | Tax Paid | Tax Assessment Tax Assessment Total Assessment is a certain percentage of the fair market value that is determined by local assessors to be the total taxable value of land and additions on the property. | Land | Improvement |
|---|---|---|---|---|
| 2025 | $19,198 | $1,349,600 | $426,500 | $923,100 |
| 2024 | $18,699 | $1,268,000 | $388,600 | $879,400 |
| 2023 | $17,777 | $1,219,000 | $370,500 | $848,500 |
| 2022 | $17,777 | $1,145,400 | $346,100 | $799,300 |
| 2021 | $17,354 | $1,049,200 | $313,200 | $736,000 |
| 2020 | $16,502 | $1,034,600 | $308,200 | $726,400 |
| 2019 | $17,155 | $924,300 | $290,600 | $633,700 |
| 2018 | $16,942 | $924,300 | $290,600 | $633,700 |
| 2017 | $16,647 | $924,300 | $290,600 | $633,700 |
| 2016 | $16,194 | $924,300 | $290,600 | $633,700 |
| 2015 | $16,027 | $924,300 | $290,600 | $633,700 |
| 2014 | $15,889 | $924,300 | $290,600 | $633,700 |
Source: Public Records
Map
Nearby Homes
- 298 Buttonwood Dr
- 105 Circle Dr
- 375 Burnet Place
- 121 Circle Dr
- 311 N Farview Ave
- 360 Valley View Ave
- 333 Harrison St
- 206 Harwood Place
- 219 N Farview Ave
- 210 Hillcrest Dr
- 156 Stuart St
- 362 Harrison St
- 461 Arthur Terrace
- 216 E Midland Ave
- 179 Clayton Terrace
- 177 Haase Ave
- 192 Thomas Dr
- 495 Wilson Ave
- 300 Spring Valley Rd
- 261 Idaho St
Your Personal Tour Guide
Ask me questions while you tour the home.