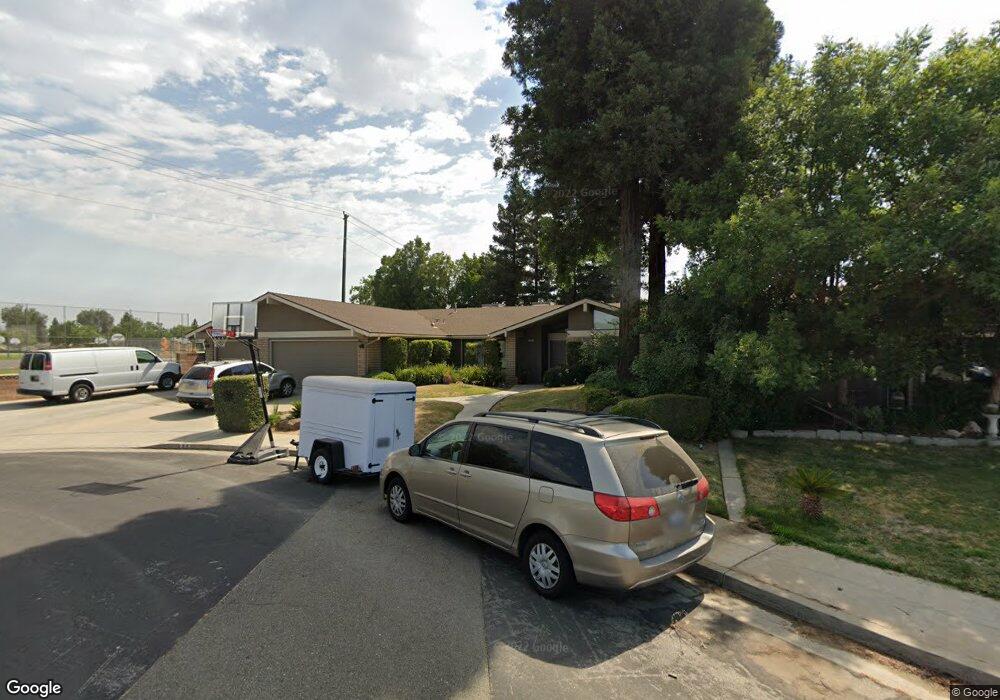
35 Cypress Ave Clovis, CA 93611
Estimated Value: $519,713 - $538,000
4
Beds
2
Baths
2,035
Sq Ft
$259/Sq Ft
Est. Value
About This Home
This home is located at 35 Cypress Ave, Clovis, CA 93611 and is currently estimated at $527,238, approximately $259 per square foot. 35 Cypress Ave is a home located in Fresno County with nearby schools including Cox Elementary School, Clark Intermediate School, and Clovis High School.
Ownership History
Date
Name
Owned For
Owner Type
Purchase Details
Closed on
Oct 28, 2011
Sold by
Kennedy Dennis W
Bought by
Alwawi Zaki M and Alwawi Nesreen O
Current Estimated Value
Home Financials for this Owner
Home Financials are based on the most recent Mortgage that was taken out on this home.
Original Mortgage
$200,969
Outstanding Balance
$136,045
Interest Rate
3.87%
Mortgage Type
FHA
Estimated Equity
$391,193
Purchase Details
Closed on
May 2, 2001
Sold by
Payne Steve S and Payne Pamela A
Bought by
Kennedy Dennis W
Home Financials for this Owner
Home Financials are based on the most recent Mortgage that was taken out on this home.
Original Mortgage
$149,850
Interest Rate
7.06%
Purchase Details
Closed on
Apr 9, 1996
Sold by
Payne Steve S
Bought by
Payne Steve S and Payne Pamela A
Purchase Details
Closed on
Mar 21, 1994
Sold by
Payne Steve S and Payne Cynthia R
Bought by
Payne Steve S
Create a Home Valuation Report for This Property
The Home Valuation Report is an in-depth analysis detailing your home's value as well as a comparison with similar homes in the area
Home Values in the Area
Average Home Value in this Area
Purchase History
| Date | Buyer | Sale Price | Title Company |
|---|---|---|---|
| Alwawi Zaki M | $206,500 | Fidelity National Title Co | |
| Kennedy Dennis W | $166,500 | Chicago Title Co | |
| Payne Steve S | -- | -- | |
| Payne Steve S | -- | -- |
Source: Public Records
Mortgage History
| Date | Status | Borrower | Loan Amount |
|---|---|---|---|
| Open | Alwawi Zaki M | $200,969 | |
| Previous Owner | Kennedy Dennis W | $149,850 |
Source: Public Records
Tax History
| Year | Tax Paid | Tax Assessment Tax Assessment Total Assessment is a certain percentage of the fair market value that is determined by local assessors to be the total taxable value of land and additions on the property. | Land | Improvement |
|---|---|---|---|---|
| 2025 | $3,062 | $258,736 | $77,618 | $181,118 |
| 2023 | $2,946 | $248,691 | $74,605 | $174,086 |
| 2022 | $2,907 | $243,816 | $73,143 | $170,673 |
| 2021 | $2,825 | $239,036 | $71,709 | $167,327 |
| 2020 | $2,815 | $236,586 | $70,974 | $165,612 |
| 2019 | $2,760 | $231,948 | $69,583 | $162,365 |
| 2018 | $2,700 | $227,401 | $68,219 | $159,182 |
| 2017 | $2,654 | $222,943 | $66,882 | $156,061 |
| 2016 | $2,564 | $218,572 | $65,571 | $153,001 |
| 2015 | $2,525 | $215,290 | $64,587 | $150,703 |
| 2014 | -- | $211,073 | $63,322 | $147,751 |
Source: Public Records
Map
Nearby Homes
- 2051 Sierra Ave
- 2216 Ellery Ave
- 2047 Menlo Ave
- 96 Burgan Ave
- 2051 Los Altos Ave
- 2043 Escalon Ave
- 2231 Escalon Ave
- 2325 Sierra Ave
- 22 N Bliss Ave
- 1855 Vartikian Ave
- 338 N Filbert Ave
- 367 N Raphael Ln Unit 367
- 344 McKelvy Ave
- 1946 Calimyrna Ave
- 2535 Sierra Ave
- 2578 Warner Ave
- 2034 Wrenwood Ave
- 2337 Wrenwood Ave
- 860 Mcarthur Ave
- 865 McKelvy Ave
Your Personal Tour Guide
Ask me questions while you tour the home.