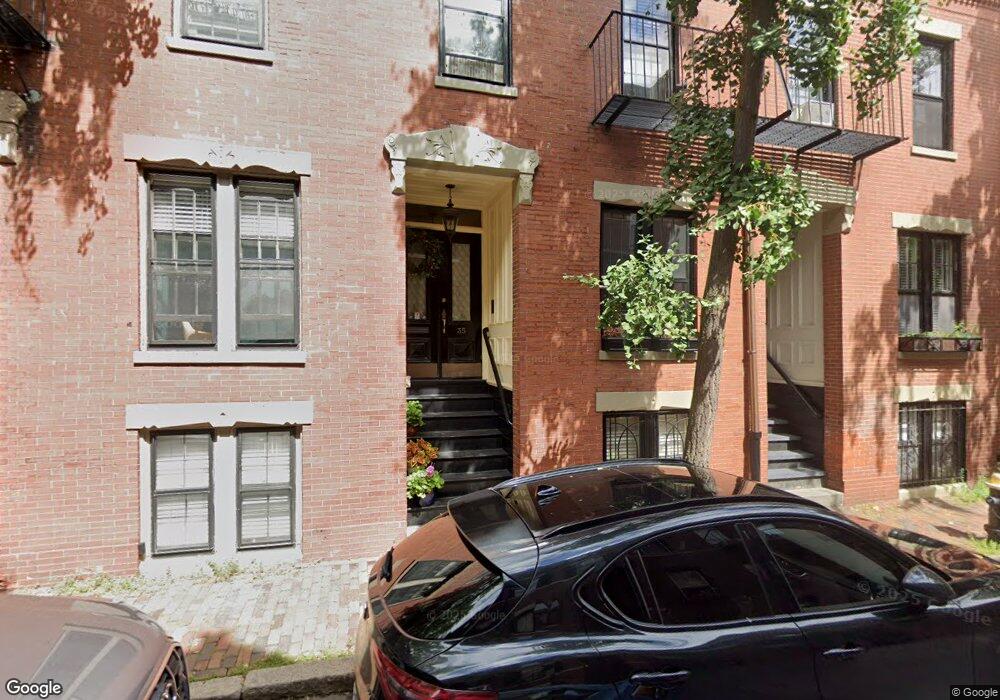
35 Gray St Boston, MA 02116
South End NeighborhoodEstimated Value: $2,290,000 - $2,633,000
3
Beds
3
Baths
1,912
Sq Ft
$1,290/Sq Ft
Est. Value
About This Home
This home is located at 35 Gray St, Boston, MA 02116 and is currently estimated at $2,466,076, approximately $1,289 per square foot. 35 Gray St is a home located in Suffolk County with nearby schools including Kingsley Montessori School and Cathedral High School.
Ownership History
Date
Name
Owned For
Owner Type
Purchase Details
Closed on
May 30, 2000
Sold by
Laz Louis R
Bought by
Shults Peter C and Shults Norine C
Current Estimated Value
Purchase Details
Closed on
Aug 16, 1999
Sold by
Vandyke Christine E and Vandyke Jeffrey J
Bought by
Laz Louis R
Purchase Details
Closed on
Dec 20, 1991
Sold by
Gore William E and Gore Helen R
Bought by
Vandyke J Jeffrey and Vandyke Christine E
Create a Home Valuation Report for This Property
The Home Valuation Report is an in-depth analysis detailing your home's value as well as a comparison with similar homes in the area
Home Values in the Area
Average Home Value in this Area
Purchase History
| Date | Buyer | Sale Price | Title Company |
|---|---|---|---|
| Shults Peter C | $689,000 | -- | |
| Laz Louis R | $675,000 | -- | |
| Vandyke J Jeffrey | $305,000 | -- |
Source: Public Records
Mortgage History
| Date | Status | Borrower | Loan Amount |
|---|---|---|---|
| Open | Vandyke J Jeffrey | $407,000 | |
| Closed | Vandyke J Jeffrey | $114,750 |
Source: Public Records
Tax History
| Year | Tax Paid | Tax Assessment Tax Assessment Total Assessment is a certain percentage of the fair market value that is determined by local assessors to be the total taxable value of land and additions on the property. | Land | Improvement |
|---|---|---|---|---|
| 2025 | $21,885 | $1,889,900 | $646,600 | $1,243,300 |
| 2024 | $20,076 | $1,841,800 | $519,800 | $1,322,000 |
| 2023 | $19,022 | $1,771,100 | $499,800 | $1,271,300 |
| 2022 | $18,535 | $1,703,600 | $480,800 | $1,222,800 |
| 2021 | $17,149 | $1,607,200 | $453,600 | $1,153,600 |
| 2020 | $16,465 | $1,559,200 | $416,500 | $1,142,700 |
| 2019 | $15,960 | $1,514,200 | $344,900 | $1,169,300 |
| 2018 | $15,412 | $1,470,600 | $344,900 | $1,125,700 |
| 2017 | $14,825 | $1,399,900 | $344,900 | $1,055,000 |
| 2016 | $14,127 | $1,284,300 | $344,900 | $939,400 |
| 2015 | $14,442 | $1,192,600 | $283,800 | $908,800 |
| 2014 | $13,485 | $1,071,900 | $283,800 | $788,100 |
Source: Public Records
Map
Nearby Homes
- 44 Appleton St
- 53 Clarendon St Unit 3
- 39 Warren Ave Unit G
- 42 Clarendon St Unit 1
- 7 Warren Ave Unit 19
- 75 Clarendon St Unit 201
- 118 Chandler St Unit 2
- 303 Columbus Ave Unit 501
- 5 Dartmouth Place
- 36 Milford St Unit 2
- 56 Dwight St Unit 2
- 1-5 Cortes St
- 13 Stanhope St Unit 1
- 19 Stanhope St Unit 3A
- 19 Stanhope St Unit 3B
- 32 Hanson St Unit 2
- 350 Columbus Ave Unit 6
- 400 Stuart St Unit 23E
- 34 Dwight St Unit 1
- 92 Waltham St Unit 1A
- 33 Gray St Unit 2A
- 33 Gray St Unit 3A
- 33 Gray St
- 33 Gray St Unit 2
- 33 Gray St Unit uni1 1-bed 1-bath
- 33 Gray St
- 33 Gray St Unit 1
- 33 Gray St Unit 3
- 31 Gray St
- 35 Gray St Unit 2
- 35 Gray St
- 35 Gray St Unit 1
- 29 Gray St Unit A
- 29 Gray St Unit 2
- 29 Gray St Unit 1
- 37 Gray St
- 37 Gray St
- 37 Gray St Unit 1
- 37 Gray St Unit 2
- 37 Gray St Unit 3
Your Personal Tour Guide
Ask me questions while you tour the home.