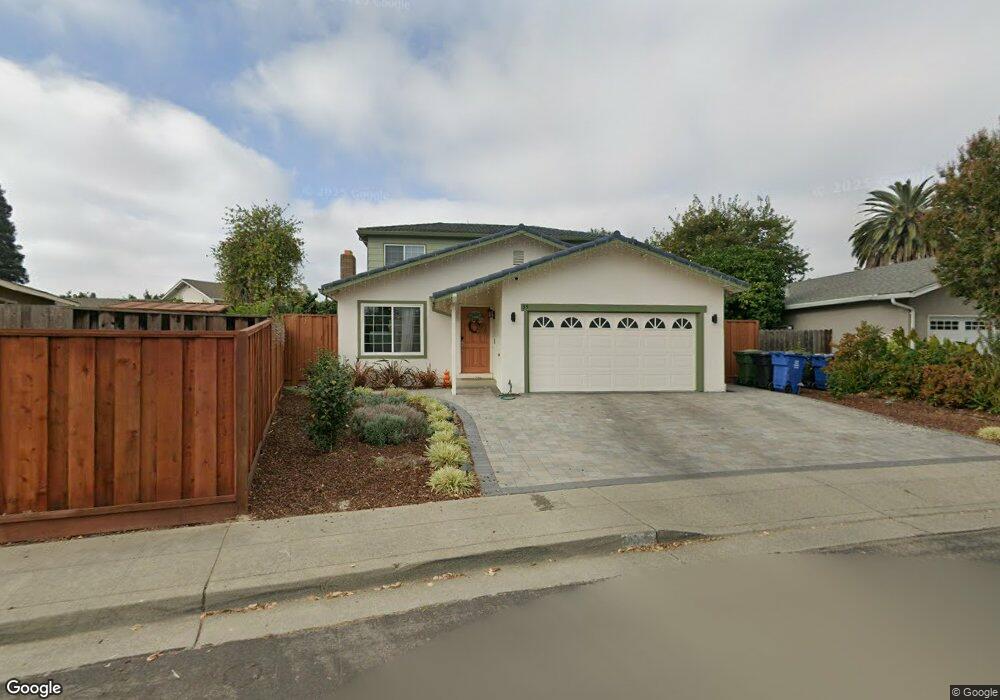
35 Greentree Cir Milpitas, CA 95035
Estimated Value: $1,467,061 - $1,858,000
6
Beds
3
Baths
1,190
Sq Ft
$1,412/Sq Ft
Est. Value
About This Home
This home is located at 35 Greentree Cir, Milpitas, CA 95035 and is currently estimated at $1,680,515, approximately $1,412 per square foot. 35 Greentree Cir is a home located in Santa Clara County with nearby schools including Pearl Zanker Elementary School, Rancho Milpitas Middle School, and Milpitas High School.
Ownership History
Date
Name
Owned For
Owner Type
Purchase Details
Closed on
Jan 13, 2018
Sold by
Luong Phuong
Bought by
Luong Phuong and Luong Don
Current Estimated Value
Purchase Details
Closed on
Jun 6, 2003
Sold by
Luong Phuong Thi and Luong Phuong
Bought by
Luong Phuong
Home Financials for this Owner
Home Financials are based on the most recent Mortgage that was taken out on this home.
Original Mortgage
$322,000
Interest Rate
3.87%
Mortgage Type
Purchase Money Mortgage
Purchase Details
Closed on
Dec 23, 2002
Sold by
Luong Phuong Thi
Bought by
Luong Phuong Thi and The Luong Family Living Trust
Purchase Details
Closed on
Apr 26, 1999
Sold by
Luong Ken and Luong Phuong T
Bought by
Luong Ken and Luong Phuong T T
Home Financials for this Owner
Home Financials are based on the most recent Mortgage that was taken out on this home.
Original Mortgage
$180,000
Interest Rate
6.94%
Create a Home Valuation Report for This Property
The Home Valuation Report is an in-depth analysis detailing your home's value as well as a comparison with similar homes in the area
Home Values in the Area
Average Home Value in this Area
Purchase History
| Date | Buyer | Sale Price | Title Company |
|---|---|---|---|
| Luong Phuong | -- | None Available | |
| Luong Phuong | -- | Alliance Title Company | |
| Luong Phuong Thi | -- | -- | |
| Luong Ken | -- | Fidelity National Title Co |
Source: Public Records
Mortgage History
| Date | Status | Borrower | Loan Amount |
|---|---|---|---|
| Closed | Luong Phuong | $322,000 | |
| Closed | Luong Ken | $180,000 |
Source: Public Records
Tax History
| Year | Tax Paid | Tax Assessment Tax Assessment Total Assessment is a certain percentage of the fair market value that is determined by local assessors to be the total taxable value of land and additions on the property. | Land | Improvement |
|---|---|---|---|---|
| 2025 | $3,540 | $291,747 | $98,416 | $193,331 |
| 2024 | $3,540 | $286,028 | $96,487 | $189,541 |
| 2023 | $3,528 | $280,421 | $94,596 | $185,825 |
| 2022 | $3,517 | $274,924 | $92,742 | $182,182 |
| 2021 | $3,466 | $269,534 | $90,924 | $178,610 |
| 2020 | $3,407 | $266,771 | $89,992 | $176,779 |
| 2019 | $3,371 | $261,541 | $88,228 | $173,313 |
| 2018 | $3,209 | $256,414 | $86,499 | $169,915 |
| 2017 | $3,169 | $251,387 | $84,803 | $166,584 |
| 2016 | $3,039 | $246,459 | $83,141 | $163,318 |
| 2015 | $3,008 | $242,758 | $81,893 | $160,865 |
| 2014 | $2,917 | $238,003 | $80,289 | $157,714 |
Source: Public Records
Map
Nearby Homes
- 1503 Canal St
- 1111 Stellar Way
- 27 S Main St
- 1864 Lee Way
- 287 Wild Rose Way
- 275 Currlin Cir
- 39 Cloud Walk Unit 328
- 2077 Lee Way
- 59 Wind Song
- 225 Houret Dr
- 460 Montague Expy Unit 40
- 430 Montague Expy Unit 20
- 1768 Capulet Dr
- 1759 Capulet Dr
- 1625 Delano St Unit 23
- 330 Riesling Ave Unit 23
- 337 Montague Expy
- 380 Riesling Ave Unit 21
- 885 Spirit Walk Unit 243
- 800 S Abel St Unit 100
- 33 Greentree Cir
- 39 Greentree Way
- 43 Greentree Way
- 51 Greentree Way
- 31 Greentree Cir
- 9 Greentree Cir
- 73 Greentree Way
- 1418 Fallen Leaf Dr
- 1406 Fallen Leaf Dr
- 27 Greentree Cir
- 7 Greentree Cir
- 1430 Fallen Leaf Dr
- 1396 Fallen Leaf Dr
- 25 Greentree Cir
- 1442 Fallen Leaf Dr
- 5 Greentree Cir
- 28 Greentree Cir
- 32 Greentree Way
- 1384 Fallen Leaf Dr
- 34 Greentree Way
Your Personal Tour Guide
Ask me questions while you tour the home.