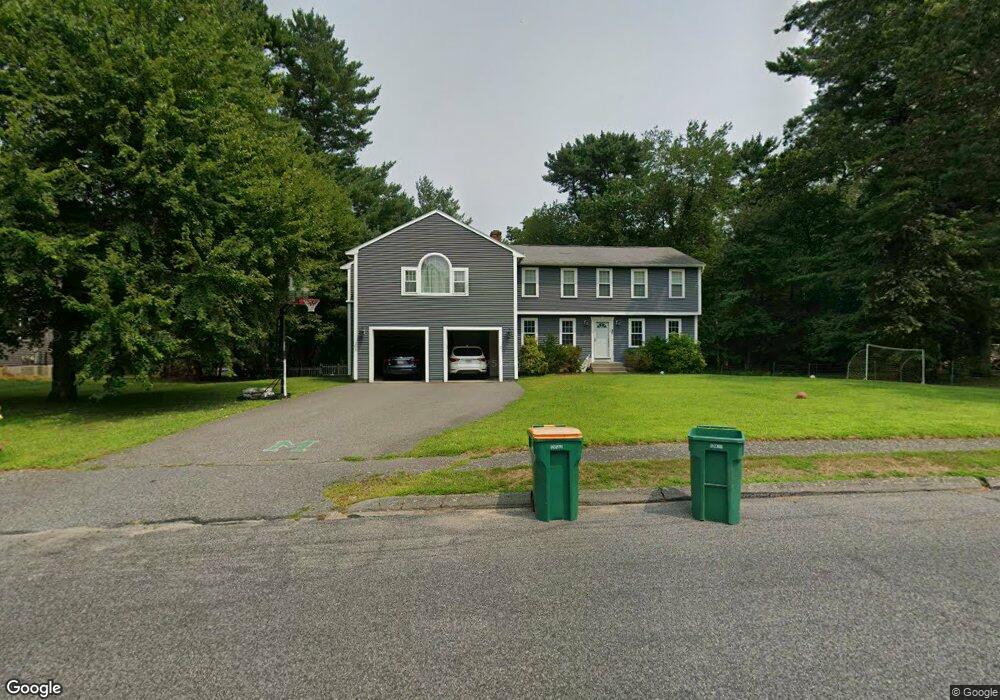
35 Lantern Ln Mansfield, MA 02048
Estimated Value: $707,000 - $974,000
4
Beds
2
Baths
1,700
Sq Ft
$494/Sq Ft
Est. Value
About This Home
This home is located at 35 Lantern Ln, Mansfield, MA 02048 and is currently estimated at $839,361, approximately $493 per square foot. 35 Lantern Ln is a home located in Bristol County with nearby schools including Everett W. Robinson Elementary School, Jordan/Jackson Elementary School, and Harold L. Qualters Middle School.
Ownership History
Date
Name
Owned For
Owner Type
Purchase Details
Closed on
Jul 28, 2006
Sold by
Jackman Chester A and Jackman Geraldine M
Bought by
Howard Mark A
Current Estimated Value
Home Financials for this Owner
Home Financials are based on the most recent Mortgage that was taken out on this home.
Original Mortgage
$290,000
Outstanding Balance
$173,259
Interest Rate
6.67%
Mortgage Type
Purchase Money Mortgage
Estimated Equity
$666,102
Create a Home Valuation Report for This Property
The Home Valuation Report is an in-depth analysis detailing your home's value as well as a comparison with similar homes in the area
Home Values in the Area
Average Home Value in this Area
Purchase History
| Date | Buyer | Sale Price | Title Company |
|---|---|---|---|
| Howard Mark A | $390,000 | -- |
Source: Public Records
Mortgage History
| Date | Status | Borrower | Loan Amount |
|---|---|---|---|
| Open | Howard Mark A | $290,000 |
Source: Public Records
Tax History Compared to Growth
Tax History
| Year | Tax Paid | Tax Assessment Tax Assessment Total Assessment is a certain percentage of the fair market value that is determined by local assessors to be the total taxable value of land and additions on the property. | Land | Improvement |
|---|---|---|---|---|
| 2025 | $10,623 | $806,600 | $265,100 | $541,500 |
| 2024 | $10,595 | $784,800 | $276,600 | $508,200 |
| 2023 | $10,174 | $722,100 | $276,600 | $445,500 |
| 2022 | $9,745 | $642,400 | $256,100 | $386,300 |
| 2021 | $9,242 | $601,700 | $213,400 | $388,300 |
| 2020 | $9,085 | $591,500 | $213,400 | $378,100 |
| 2019 | $8,513 | $559,300 | $177,800 | $381,500 |
| 2018 | $8,113 | $544,200 | $169,500 | $374,700 |
| 2017 | $7,947 | $529,100 | $164,500 | $364,600 |
| 2016 | $7,616 | $494,200 | $156,600 | $337,600 |
| 2015 | $7,398 | $477,300 | $156,600 | $320,700 |
Source: Public Records
Map
Nearby Homes
- 176 Elm St
- 2 Oak St Unit 2D
- 2 Oak St Unit 2A
- 2 Oak St Unit 2C
- 2 Oak St Unit 2B
- 37 Oakleaf Dr
- 451R Gilbert St
- 4 Buckskin Dr
- 250 Mansfield Ave Unit 66
- 150 Gilbert St
- 15 Reservoir St Unit 44
- 14 Country Club Way
- 255 Mckeon Dr
- 157 Mansfield Ave Unit 14
- 18 Columbine Rd
- 231 Spring St
- 4 Village Way Unit F
- 15 Rock Ln
- 24 Maverick Dr
- 21 Juniper Rd