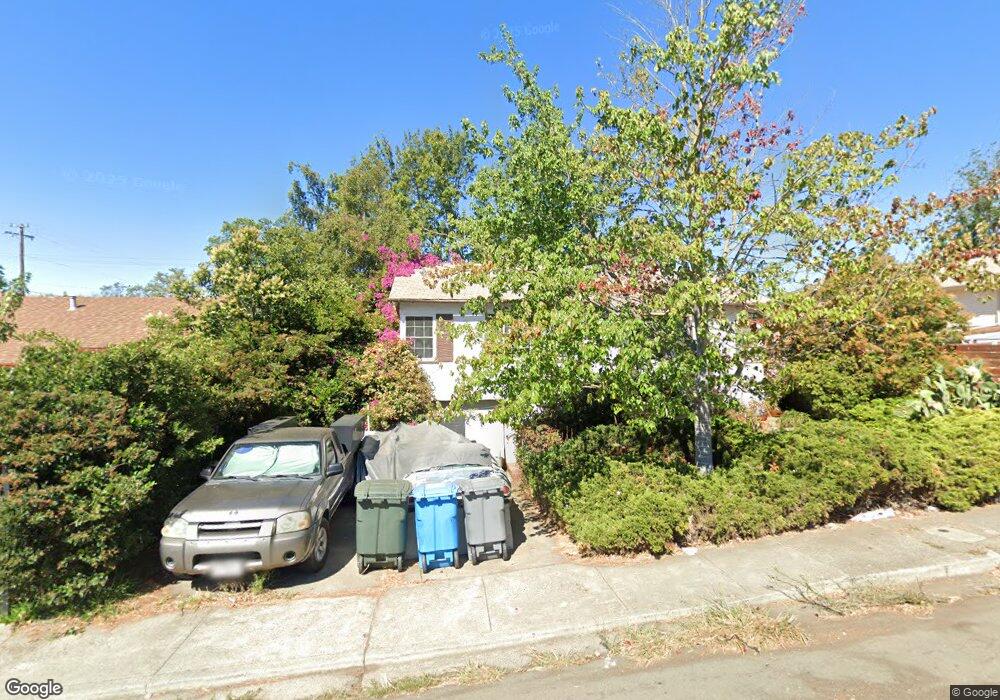
35 Laurel St Vallejo, CA 94591
South Vallejo NeighborhoodEstimated Value: $410,000 - $443,000
3
Beds
1
Bath
1,361
Sq Ft
$316/Sq Ft
Est. Value
About This Home
This home is located at 35 Laurel St, Vallejo, CA 94591 and is currently estimated at $429,832, approximately $315 per square foot. 35 Laurel St is a home located in Solano County with nearby schools including Jesse M. Bethel High School, Mustard Seed Preschool and Kindergarten, and North Hills Christian School.
Ownership History
Date
Name
Owned For
Owner Type
Purchase Details
Closed on
Apr 29, 2010
Sold by
Bratt James M
Bought by
Huerta Marcela
Current Estimated Value
Home Financials for this Owner
Home Financials are based on the most recent Mortgage that was taken out on this home.
Original Mortgage
$132,554
Outstanding Balance
$90,780
Interest Rate
5.5%
Mortgage Type
FHA
Estimated Equity
$339,052
Purchase Details
Closed on
May 9, 2007
Sold by
Bratt Marion G
Bought by
Bratt James M
Create a Home Valuation Report for This Property
The Home Valuation Report is an in-depth analysis detailing your home's value as well as a comparison with similar homes in the area
Home Values in the Area
Average Home Value in this Area
Purchase History
| Date | Buyer | Sale Price | Title Company |
|---|---|---|---|
| Huerta Marcela | $135,000 | Fidelity National Title Co | |
| Bratt James M | -- | None Available |
Source: Public Records
Mortgage History
| Date | Status | Borrower | Loan Amount |
|---|---|---|---|
| Open | Huerta Marcela | $132,554 |
Source: Public Records
Tax History
| Year | Tax Paid | Tax Assessment Tax Assessment Total Assessment is a certain percentage of the fair market value that is determined by local assessors to be the total taxable value of land and additions on the property. | Land | Improvement |
|---|---|---|---|---|
| 2025 | $3,062 | $174,249 | $25,810 | $148,439 |
| 2024 | $3,062 | $170,833 | $25,304 | $145,529 |
| 2023 | $2,854 | $167,484 | $24,808 | $142,676 |
| 2022 | $2,750 | $164,201 | $24,322 | $139,879 |
| 2021 | $2,688 | $160,983 | $23,846 | $137,137 |
| 2020 | $2,685 | $159,333 | $23,602 | $135,731 |
| 2019 | $2,589 | $156,210 | $23,140 | $133,070 |
| 2018 | $2,414 | $153,148 | $22,687 | $130,461 |
| 2017 | $2,292 | $150,146 | $22,243 | $127,903 |
| 2016 | $1,722 | $147,203 | $21,807 | $125,396 |
| 2015 | $1,700 | $144,993 | $21,480 | $123,513 |
| 2014 | $1,676 | $142,154 | $21,060 | $121,094 |
Source: Public Records
Map
Nearby Homes
Your Personal Tour Guide
Ask me questions while you tour the home.