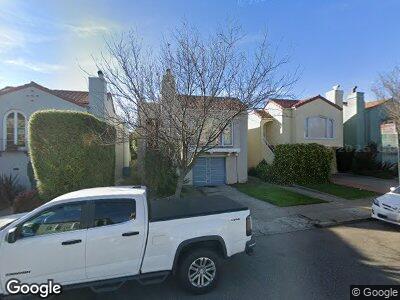
35 Loraine Ct San Francisco, CA 94118
Lone Mountain NeighborhoodEstimated Value: $1,683,000 - $2,114,859
2
Beds
2
Baths
1,724
Sq Ft
$1,126/Sq Ft
Est. Value
About This Home
This home is located at 35 Loraine Ct, San Francisco, CA 94118 and is currently estimated at $1,941,215, approximately $1,125 per square foot. 35 Loraine Ct is a home located in San Francisco County with nearby schools including New Traditions Elementary School, Roosevelt Middle School, and Zion Lutheran School.
Ownership History
Date
Name
Owned For
Owner Type
Purchase Details
Closed on
Jul 24, 2017
Sold by
Winkelhake Loraine Mieko and Reyes Katherine K
Bought by
Hinners Roland W and Krucik George
Current Estimated Value
Purchase Details
Closed on
Oct 28, 2013
Sold by
Hinners Roland W
Bought by
Hinners Roland W
Home Financials for this Owner
Home Financials are based on the most recent Mortgage that was taken out on this home.
Original Mortgage
$721,600
Interest Rate
4.25%
Mortgage Type
New Conventional
Purchase Details
Closed on
May 3, 2006
Sold by
Hinners Viola F
Bought by
Hinners Roland W
Home Financials for this Owner
Home Financials are based on the most recent Mortgage that was taken out on this home.
Original Mortgage
$725,000
Interest Rate
6.3%
Mortgage Type
Fannie Mae Freddie Mac
Purchase Details
Closed on
Apr 20, 2001
Sold by
Reyes Katherine K
Bought by
Reyes Katherine K
Create a Home Valuation Report for This Property
The Home Valuation Report is an in-depth analysis detailing your home's value as well as a comparison with similar homes in the area
Home Values in the Area
Average Home Value in this Area
Purchase History
| Date | Buyer | Sale Price | Title Company |
|---|---|---|---|
| Hinners Roland W | -- | None Available | |
| Hinners Roland W | -- | Chicago Title Company | |
| Hinners Roland W | -- | Stewart Title Company | |
| Hinners Roland W | $1,125,000 | Stewart Title Company | |
| Reyes Katherine K | -- | -- |
Source: Public Records
Mortgage History
| Date | Status | Borrower | Loan Amount |
|---|---|---|---|
| Previous Owner | Hinners Roland W | $721,600 | |
| Previous Owner | Hinners Roland W | $729,750 | |
| Previous Owner | Hinners Roland W | $725,000 | |
| Previous Owner | Reyes Katherine K | $220,000 |
Source: Public Records
Tax History Compared to Growth
Tax History
| Year | Tax Paid | Tax Assessment Tax Assessment Total Assessment is a certain percentage of the fair market value that is determined by local assessors to be the total taxable value of land and additions on the property. | Land | Improvement |
|---|---|---|---|---|
| 2024 | $18,553 | $1,507,249 | $904,351 | $602,898 |
| 2023 | $18,229 | $1,477,696 | $886,619 | $591,077 |
| 2022 | $17,876 | $1,448,723 | $869,235 | $579,488 |
| 2021 | $17,561 | $1,420,318 | $852,192 | $568,126 |
| 2020 | $17,690 | $1,405,755 | $843,454 | $562,301 |
| 2019 | $17,037 | $1,378,192 | $826,916 | $551,276 |
| 2018 | $16,465 | $1,351,169 | $810,702 | $540,467 |
| 2017 | $15,973 | $1,324,676 | $794,806 | $529,870 |
| 2016 | $15,718 | $1,298,703 | $779,222 | $519,481 |
| 2015 | $15,525 | $1,279,196 | $767,518 | $511,678 |
| 2014 | $15,118 | $1,254,139 | $752,484 | $501,655 |
Source: Public Records
Map
Nearby Homes
- 35 Loraine Ct
- 45 Loraine Ct
- 25 Loraine Ct
- 55 Loraine Ct
- 15 Loraine Ct
- 65 Loraine Ct
- 56 Almaden Ct
- 5 Loraine Ct
- 52 Almaden Ct
- 60 Almaden Ct
- 48 Almaden Ct
- 74 Almaden Ct
- 75 Loraine Ct
- 44 Almaden Ct
- 40 Almaden Ct
- 960 Anza St Unit 3
- 960 Anza St Unit 8
- 960 Anza St Unit 1
- 960 Anza St Unit 2
- 960 Anza St Unit 6