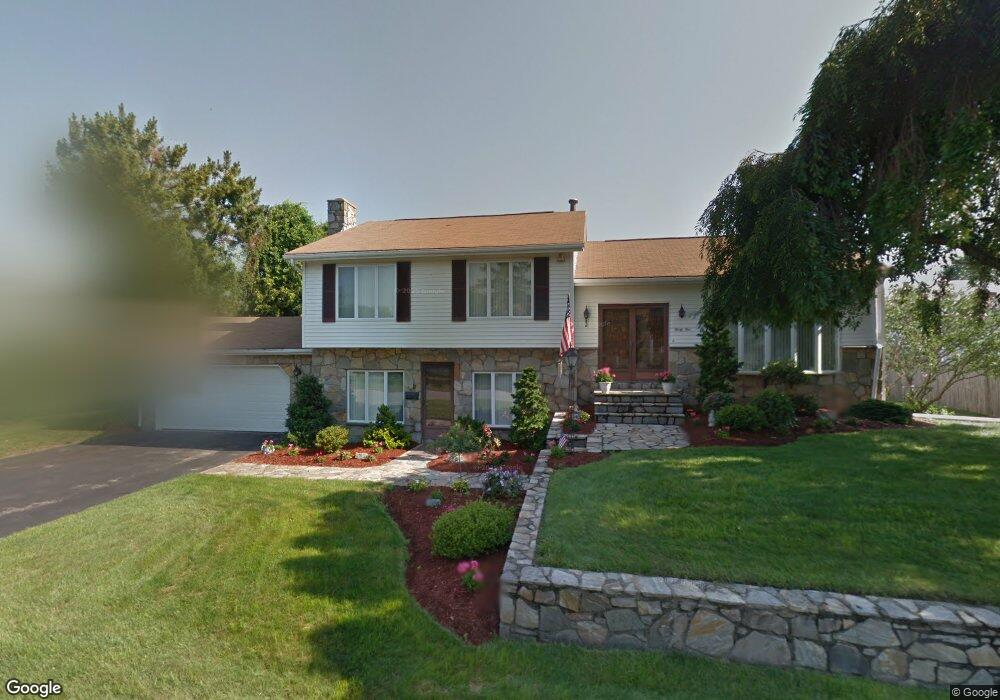
35 Macbeth St Cranston, RI 02920
Budlong NeighborhoodEstimated Value: $468,000 - $546,924
3
Beds
2
Baths
1,560
Sq Ft
$332/Sq Ft
Est. Value
About This Home
This home is located at 35 Macbeth St, Cranston, RI 02920 and is currently estimated at $518,481, approximately $332 per square foot. 35 Macbeth St is a home located in Providence County with nearby schools including Woodridge Elementary School, Western Hills Middle School, and Cranston High School West.
Ownership History
Date
Name
Owned For
Owner Type
Purchase Details
Closed on
Sep 5, 2024
Sold by
Alviano Michael
Bought by
Alviano Michael and Alviano David M
Current Estimated Value
Purchase Details
Closed on
Dec 26, 1996
Sold by
Alviano Michael
Bought by
A Ialongo Bldg Co Inc
Create a Home Valuation Report for This Property
The Home Valuation Report is an in-depth analysis detailing your home's value as well as a comparison with similar homes in the area
Home Values in the Area
Average Home Value in this Area
Purchase History
| Date | Buyer | Sale Price | Title Company |
|---|---|---|---|
| Alviano Michael | -- | None Available | |
| Alviano Michael | -- | None Available | |
| A Ialongo Bldg Co Inc | $42,000 | -- | |
| A Ialongo Bldg Co Inc | $42,000 | -- |
Source: Public Records
Mortgage History
| Date | Status | Borrower | Loan Amount |
|---|---|---|---|
| Previous Owner | A Ialongo Bldg Co Inc | $474,525 | |
| Previous Owner | A Ialongo Bldg Co Inc | $100,000 | |
| Previous Owner | A Ialongo Bldg Co Inc | $75,500 |
Source: Public Records
Tax History
| Year | Tax Paid | Tax Assessment Tax Assessment Total Assessment is a certain percentage of the fair market value that is determined by local assessors to be the total taxable value of land and additions on the property. | Land | Improvement |
|---|---|---|---|---|
| 2025 | $6,288 | $453,000 | $103,800 | $349,200 |
| 2024 | $6,165 | $453,000 | $103,800 | $349,200 |
| 2023 | $6,233 | $329,800 | $68,300 | $261,500 |
| 2022 | $6,105 | $329,800 | $68,300 | $261,500 |
| 2021 | $5,936 | $329,800 | $68,300 | $261,500 |
| 2020 | $5,959 | $286,900 | $65,100 | $221,800 |
| 2019 | $5,959 | $286,900 | $65,100 | $221,800 |
| 2018 | $5,821 | $286,900 | $65,100 | $221,800 |
| 2017 | $5,974 | $260,400 | $58,600 | $201,800 |
| 2016 | $5,846 | $260,400 | $58,600 | $201,800 |
Source: Public Records
Map
Nearby Homes
Your Personal Tour Guide
Ask me questions while you tour the home.