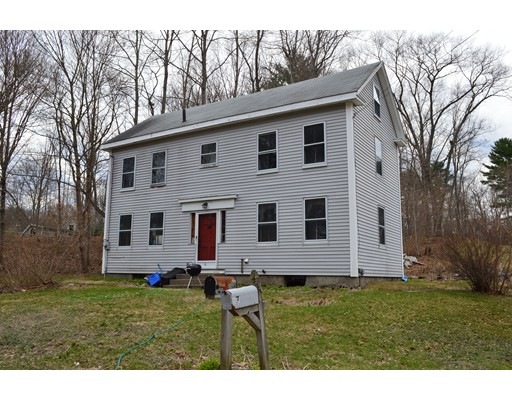
35 Main St Byfield, MA 01922
About This Home
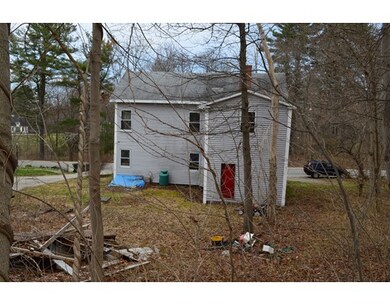
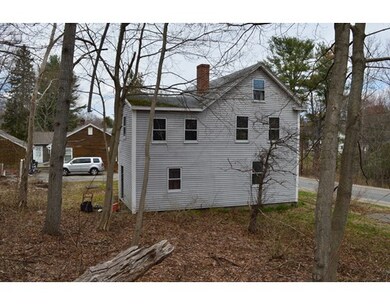
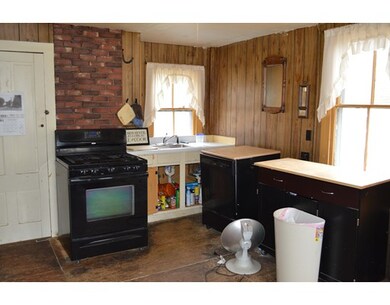
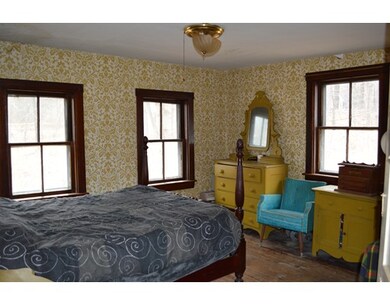
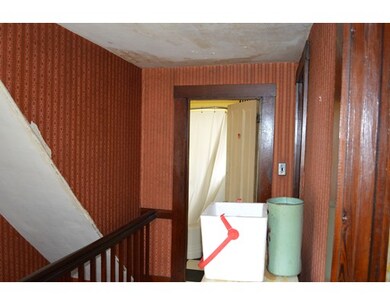
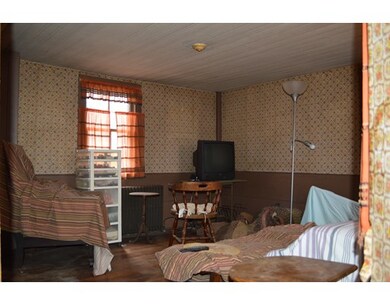
As of August 2017Contractor special! House on lot with frontage on Main and West Street. House in major rehab or teardown condition, sold as is. Bring your offers!

Ownership History
Purchase Details
Home Financials for this Owner
Home Financials are based on the most recent Mortgage that was taken out on this home.Purchase Details
Home Financials for this Owner
Home Financials are based on the most recent Mortgage that was taken out on this home.Purchase Details
Map
Home Details
Home Type
Single Family
Est. Annual Taxes
$7,160
Year Built
1765
Lot Details
0
Listing Details
- Lot Description: Wooded, Sloping
- Other Agent: 2.25
- Special Features: None
- Property Sub Type: Detached
- Year Built: 1765
Interior Features
- Fireplaces: 2
- Has Basement: Yes
- Fireplaces: 2
- Number of Rooms: 7
- Amenities: Public Transportation, Shopping, Walk/Jog Trails, Stables, Golf Course, Medical Facility, Highway Access, Public School, T-Station
Exterior Features
- Roof: Asphalt/Fiberglass Shingles
- Exterior: Vinyl
- Foundation: Fieldstone
Garage/Parking
- Parking Spaces: 4
Utilities
- Cooling: None
- Heating: Hot Water Baseboard, Oil
- Hot Water: Oil
Lot Info
- Assessor Parcel Number: M:0U14 B:0000 L:00029
Home Values in the Area
Average Home Value in this Area
Purchase History
| Date | Type | Sale Price | Title Company |
|---|---|---|---|
| Not Resolvable | $579,000 | -- | |
| Deed | $155,000 | -- | |
| Deed | $22,500 | -- |
Mortgage History
| Date | Status | Loan Amount | Loan Type |
|---|---|---|---|
| Open | $200,000 | Credit Line Revolving | |
| Open | $471,500 | Stand Alone Refi Refinance Of Original Loan | |
| Closed | $473,000 | Stand Alone Refi Refinance Of Original Loan | |
| Closed | $476,000 | Stand Alone Refi Refinance Of Original Loan | |
| Closed | $453,100 | Stand Alone Refi Refinance Of Original Loan | |
| Closed | $463,200 | New Conventional | |
| Closed | $57,900 | Unknown | |
| Previous Owner | $32,764 | No Value Available | |
| Previous Owner | $30,000 | No Value Available |
Property History
| Date | Event | Price | Change | Sq Ft Price |
|---|---|---|---|---|
| 08/07/2017 08/07/17 | Sold | $579,000 | 0.0% | $223 / Sq Ft |
| 06/22/2017 06/22/17 | Pending | -- | -- | -- |
| 06/20/2017 06/20/17 | Price Changed | $579,000 | -3.3% | $223 / Sq Ft |
| 05/11/2017 05/11/17 | Price Changed | $599,000 | -4.8% | $230 / Sq Ft |
| 04/27/2017 04/27/17 | Price Changed | $629,000 | -3.1% | $242 / Sq Ft |
| 11/25/2016 11/25/16 | Price Changed | $649,000 | -4.4% | $250 / Sq Ft |
| 10/27/2016 10/27/16 | For Sale | $679,000 | +338.1% | $261 / Sq Ft |
| 08/28/2015 08/28/15 | Sold | $155,000 | 0.0% | $100 / Sq Ft |
| 08/03/2015 08/03/15 | Pending | -- | -- | -- |
| 06/16/2015 06/16/15 | Off Market | $155,000 | -- | -- |
| 06/09/2015 06/09/15 | Price Changed | $215,000 | -10.0% | $139 / Sq Ft |
| 06/09/2015 06/09/15 | For Sale | $239,000 | 0.0% | $154 / Sq Ft |
| 06/03/2015 06/03/15 | Pending | -- | -- | -- |
| 05/13/2015 05/13/15 | For Sale | $239,000 | -- | $154 / Sq Ft |
Tax History
| Year | Tax Paid | Tax Assessment Tax Assessment Total Assessment is a certain percentage of the fair market value that is determined by local assessors to be the total taxable value of land and additions on the property. | Land | Improvement |
|---|---|---|---|---|
| 2025 | $7,160 | $961,100 | $369,100 | $592,000 |
| 2024 | $6,764 | $880,700 | $330,300 | $550,400 |
| 2023 | $6,810 | $785,500 | $281,700 | $503,800 |
| 2022 | $6,756 | $694,300 | $252,500 | $441,800 |
| 2021 | $6,440 | $604,100 | $194,300 | $409,800 |
| 2020 | $6,465 | $588,300 | $194,300 | $394,000 |
| 2019 | $6,342 | $586,700 | $174,800 | $411,900 |
| 2018 | $6,108 | $560,400 | $174,800 | $385,600 |
| 2017 | $3,323 | $313,200 | $174,800 | $138,400 |
| 2016 | $3,647 | $319,900 | $136,000 | $183,900 |
| 2015 | $3,545 | $307,700 | $126,300 | $181,400 |
| 2014 | $3,321 | $293,400 | $126,300 | $167,100 |
Source: MLS Property Information Network (MLS PIN)
MLS Number: 71835421
APN: NEWB-000014U-000000-000029
Disclaimer: Certain information contained herein is derived from information provided by parties other than Homes.com. All information provided is deemed reliable, but is not guaranteed to be accurate and should be independently verified.
![]() The property listing data and information, or the Images, set forth herein were provided to MLS Property Information Network, Inc. from third party sources, including sellers, lessors and public records, and were compiled by MLS Property Information Network, Inc. The property listing data and information, and the Images, are for the personal, non-commercial use of consumers having a good faith interest in purchasing or leasing listed properties of the type displayed to them and may not be used for any purpose other than to identify prospective properties which such consumers may have a good faith interest in purchasing or leasing. MLS Property Information Network, Inc. and its subscribers disclaim any and all representations and warranties as to the accuracy of the property listing data and information, or as to the accuracy of any of the Images, set forth herein.
The property listing data and information, or the Images, set forth herein were provided to MLS Property Information Network, Inc. from third party sources, including sellers, lessors and public records, and were compiled by MLS Property Information Network, Inc. The property listing data and information, and the Images, are for the personal, non-commercial use of consumers having a good faith interest in purchasing or leasing listed properties of the type displayed to them and may not be used for any purpose other than to identify prospective properties which such consumers may have a good faith interest in purchasing or leasing. MLS Property Information Network, Inc. and its subscribers disclaim any and all representations and warranties as to the accuracy of the property listing data and information, or as to the accuracy of any of the Images, set forth herein.
- 18 River St
- 18 Forest St
- 15 Central St
- 4 Swanton Way
- 32 Central St
- 34 Central St
- 66 Parish Rd Unit 2
- 66 Parish Rd Unit 3
- 5 Courser Brook Dr
- 452 North St
- 55 Pearson Dr
- 172 Orchard St
- 88 Jackman St
- 39 Fatherland Dr
- 66 Warren St
- 116-118 Jewett St
- LOT 2 Cricket Ln Unit THE BIRCH
- LOT 3 Cricket Ln Unit THE ALDER
- 151 Jewett St
- 2 School St