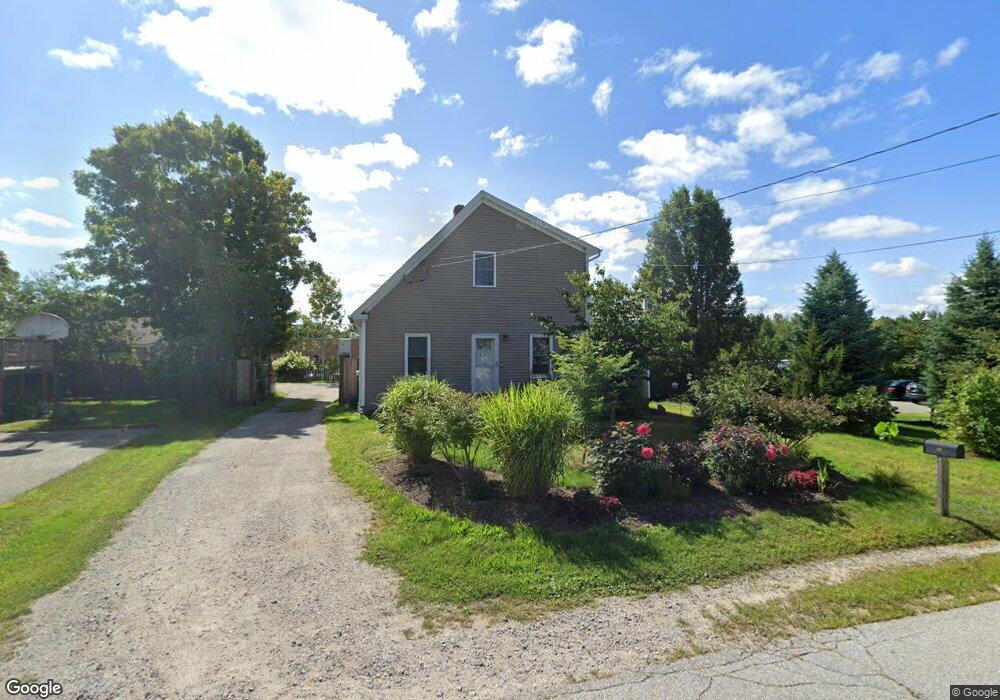
35 Mill St Epping, NH 03042
Estimated Value: $391,000 - $458,000
1
Bed
1
Bath
780
Sq Ft
$548/Sq Ft
Est. Value
About This Home
This home is located at 35 Mill St, Epping, NH 03042 and is currently estimated at $427,782, approximately $548 per square foot. 35 Mill St is a home located in Rockingham County with nearby schools including Epping Elementary School, Epping Middle School, and Epping High School.
Ownership History
Date
Name
Owned For
Owner Type
Purchase Details
Closed on
Mar 3, 2010
Sold by
Stilson John J
Bought by
Anderson Angela
Current Estimated Value
Home Financials for this Owner
Home Financials are based on the most recent Mortgage that was taken out on this home.
Original Mortgage
$137,755
Outstanding Balance
$91,392
Interest Rate
5%
Mortgage Type
Purchase Money Mortgage
Estimated Equity
$336,390
Create a Home Valuation Report for This Property
The Home Valuation Report is an in-depth analysis detailing your home's value as well as a comparison with similar homes in the area
Home Values in the Area
Average Home Value in this Area
Purchase History
| Date | Buyer | Sale Price | Title Company |
|---|---|---|---|
| Anderson Angela | $135,000 | -- |
Source: Public Records
Mortgage History
| Date | Status | Borrower | Loan Amount |
|---|---|---|---|
| Open | Anderson Angela | $25,000 | |
| Open | Anderson Angela | $137,755 |
Source: Public Records
Tax History
| Year | Tax Paid | Tax Assessment Tax Assessment Total Assessment is a certain percentage of the fair market value that is determined by local assessors to be the total taxable value of land and additions on the property. | Land | Improvement |
|---|---|---|---|---|
| 2024 | $6,244 | $247,500 | $72,200 | $175,300 |
| 2023 | $5,792 | $247,500 | $72,200 | $175,300 |
| 2022 | $5,566 | $247,500 | $72,200 | $175,300 |
| 2021 | $5,549 | $247,500 | $72,200 | $175,300 |
| 2020 | $5,851 | $247,500 | $72,200 | $175,300 |
| 2019 | $5,321 | $192,100 | $66,300 | $125,800 |
| 2018 | $4,984 | $192,100 | $66,300 | $125,800 |
| 2017 | $4,983 | $192,100 | $66,300 | $125,800 |
| 2016 | $4,373 | $168,600 | $66,300 | $102,300 |
| 2015 | $4,270 | $164,600 | $66,300 | $98,300 |
| 2014 | $3,927 | $160,800 | $66,300 | $94,500 |
| 2013 | $3,393 | $139,800 | $66,300 | $73,500 |
Source: Public Records
Map
Nearby Homes
- 13 Elm St
- 290 Calef Hwy Unit B21
- 2 Prescott Rd
- 16B Lunas Ave Unit 16B
- 27 Mulberry Ln
- 5A Connor Ct Unit 5A
- 23 Old Stage Coach Rd Unit 8
- 1B Connor Ct Unit 1B
- 46 Dorothy Dr
- 65 Sunset Ridge Rd Unit 65A
- 65 Sunset Ridge Rd Unit 65B
- 63 Sunset Ridge Rd Unit 63A
- 63 Sunset Ridge Rd Unit 63B
- 1A Connor Ct Unit 1A
- 3A Connor Ct Unit 3A
- 153 Coffin Rd Unit 22
- 153 Coffin Rd Unit 19
- 153 Coffin Rd Unit 24
- 5 Hedding Rd
- 54 Sunset Ridge Rd Unit 54B
Your Personal Tour Guide
Ask me questions while you tour the home.