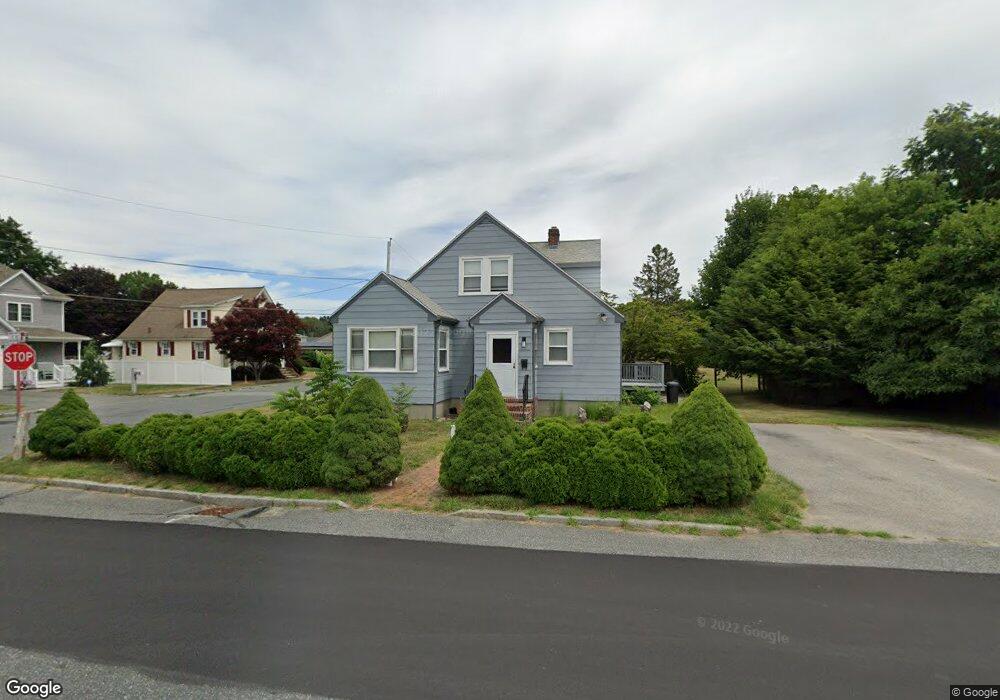
35 North St Milford, MA 01757
Estimated Value: $418,000 - $523,000
2
Beds
2
Baths
1,840
Sq Ft
$260/Sq Ft
Est. Value
About This Home
This home is located at 35 North St, Milford, MA 01757 and is currently estimated at $477,837, approximately $259 per square foot. 35 North St is a home located in Worcester County with nearby schools including Milford High School and Bethany Christian Academy.
Ownership History
Date
Name
Owned For
Owner Type
Purchase Details
Closed on
Oct 31, 2018
Sold by
Ferreira John E
Bought by
Omeara John K
Current Estimated Value
Home Financials for this Owner
Home Financials are based on the most recent Mortgage that was taken out on this home.
Original Mortgage
$164,000
Outstanding Balance
$143,612
Interest Rate
4.6%
Mortgage Type
New Conventional
Estimated Equity
$334,225
Purchase Details
Closed on
Aug 29, 2006
Sold by
Ferreira Anthony C and Ferreira John E
Bought by
Ferreira John E
Purchase Details
Closed on
Apr 29, 1993
Sold by
Rizoli Edward J and Rizoli Elaine E
Bought by
Ferreira Rita M and Ferreira John
Create a Home Valuation Report for This Property
The Home Valuation Report is an in-depth analysis detailing your home's value as well as a comparison with similar homes in the area
Home Values in the Area
Average Home Value in this Area
Purchase History
| Date | Buyer | Sale Price | Title Company |
|---|---|---|---|
| Omeara John K | $205,000 | -- | |
| Ferreira John E | -- | -- | |
| Ferreira Rita M | $129,000 | -- |
Source: Public Records
Mortgage History
| Date | Status | Borrower | Loan Amount |
|---|---|---|---|
| Open | Omeara John K | $164,000 |
Source: Public Records
Tax History Compared to Growth
Tax History
| Year | Tax Paid | Tax Assessment Tax Assessment Total Assessment is a certain percentage of the fair market value that is determined by local assessors to be the total taxable value of land and additions on the property. | Land | Improvement |
|---|---|---|---|---|
| 2025 | $5,023 | $392,400 | $152,000 | $240,400 |
| 2024 | $4,867 | $366,200 | $145,000 | $221,200 |
| 2023 | $4,628 | $320,300 | $122,000 | $198,300 |
| 2022 | $4,483 | $291,300 | $111,400 | $179,900 |
| 2021 | $4,267 | $267,000 | $111,400 | $155,600 |
| 2020 | $4,159 | $260,600 | $111,400 | $149,200 |
| 2019 | $4,340 | $262,400 | $111,400 | $151,000 |
| 2018 | $4,099 | $247,500 | $106,100 | $141,400 |
| 2017 | $3,889 | $231,600 | $106,100 | $125,500 |
| 2016 | $3,606 | $209,900 | $95,500 | $114,400 |
| 2015 | $3,499 | $199,400 | $91,900 | $107,500 |
Source: Public Records
Map
Nearby Homes
- Lot 1 Florence St
- 15 Free St
- 4 E Charles St
- 17 Middleton St
- 35 Woodland Ave Unit 35A
- 27 Grant St
- 39 Emmons St
- 104 Purchase St
- 57 Beach St
- 9 Hillside Ave
- 55 Jefferson St
- 102-104 Central St
- 3 Shadowbrook Ln Unit 3
- 130 Purchase St
- 3 S Central St
- 12 Blanchard Rd
- 56 S Bow St
- 11 Shadowbrook Ln Unit 9
- 2 Larson Rd
- 9 Packard Rd