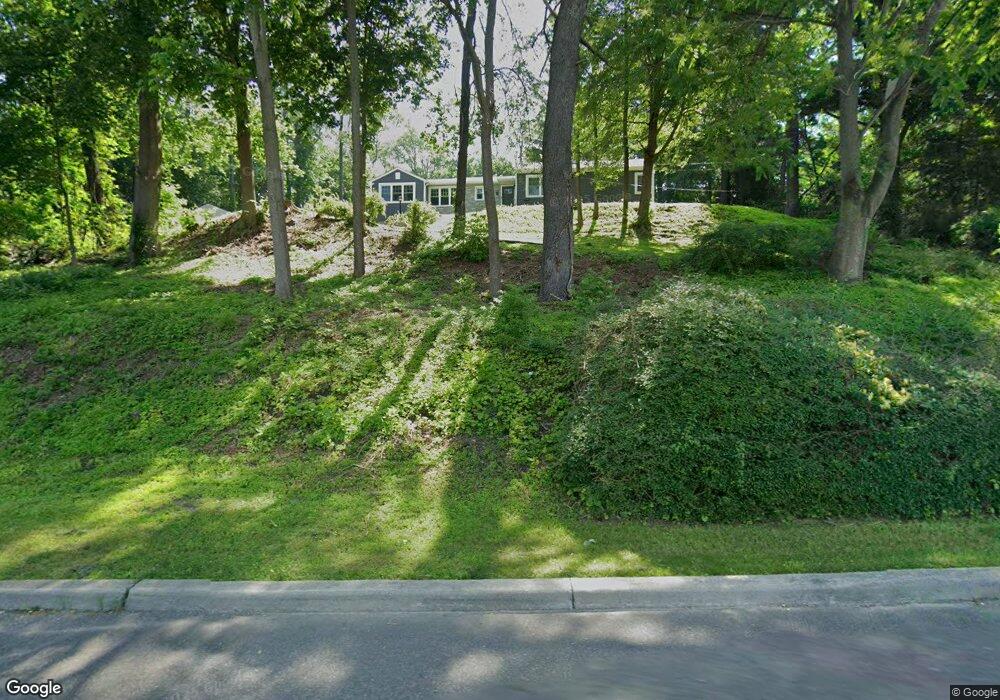
35 Noxon Rd Poughkeepsie, NY 12603
Estimated Value: $329,000 - $411,000
4
Beds
1
Bath
1,280
Sq Ft
$300/Sq Ft
Est. Value
About This Home
This home is located at 35 Noxon Rd, Poughkeepsie, NY 12603 and is currently estimated at $384,494, approximately $300 per square foot. 35 Noxon Rd is a home located in Dutchess County with nearby schools including Arlington High School, Hawk Meadow Montessori School, and Holy Trinity School.
Ownership History
Date
Name
Owned For
Owner Type
Purchase Details
Closed on
May 26, 2005
Sold by
Vega Yvette
Bought by
Gonzalez Yvette
Current Estimated Value
Home Financials for this Owner
Home Financials are based on the most recent Mortgage that was taken out on this home.
Original Mortgage
$250,000
Outstanding Balance
$41,855
Interest Rate
5.78%
Mortgage Type
Purchase Money Mortgage
Estimated Equity
$342,639
Purchase Details
Closed on
Nov 23, 1998
Sold by
George Odell and George Dolores
Bought by
Vega Yvette
Create a Home Valuation Report for This Property
The Home Valuation Report is an in-depth analysis detailing your home's value as well as a comparison with similar homes in the area
Home Values in the Area
Average Home Value in this Area
Purchase History
| Date | Buyer | Sale Price | Title Company |
|---|---|---|---|
| Gonzalez Yvette | -- | -- | |
| Vega Yvette | $113,000 | -- |
Source: Public Records
Mortgage History
| Date | Status | Borrower | Loan Amount |
|---|---|---|---|
| Open | Gonzalez Yvette | $250,000 |
Source: Public Records
Tax History
| Year | Tax Paid | Tax Assessment Tax Assessment Total Assessment is a certain percentage of the fair market value that is determined by local assessors to be the total taxable value of land and additions on the property. | Land | Improvement |
|---|---|---|---|---|
| 2024 | $8,631 | $234,100 | $60,500 | $173,600 |
| 2023 | $10,699 | $234,100 | $60,500 | $173,600 |
| 2019 | $7,628 | $234,100 | $60,500 | $173,600 |
Source: Public Records
Map
Nearby Homes
- Maloney Rd
- 10 Meier Rd
- 13 Robert Rd
- 202 Ridgeline Dr
- 0 Hillcrest Dr Unit KEY960221
- 52 Clover Hill Dr
- 15 Milano Dr
- 5 Chestnut Ridge Rd
- 42 Feller Ct
- 36 Spruce Ln
- 210 Overlook Rd
- 27 King Dr
- 392 Titusville Rd
- 5 Larch Ct
- 19 Ridgeview Rd
- 321 Titusville Rd - 128
- 0 Gentry Bend Unit ONEH6332533
- 322 Noxon Rd
- 261 Titusville Rd
- 36 Vassar View Rd
Your Personal Tour Guide
Ask me questions while you tour the home.