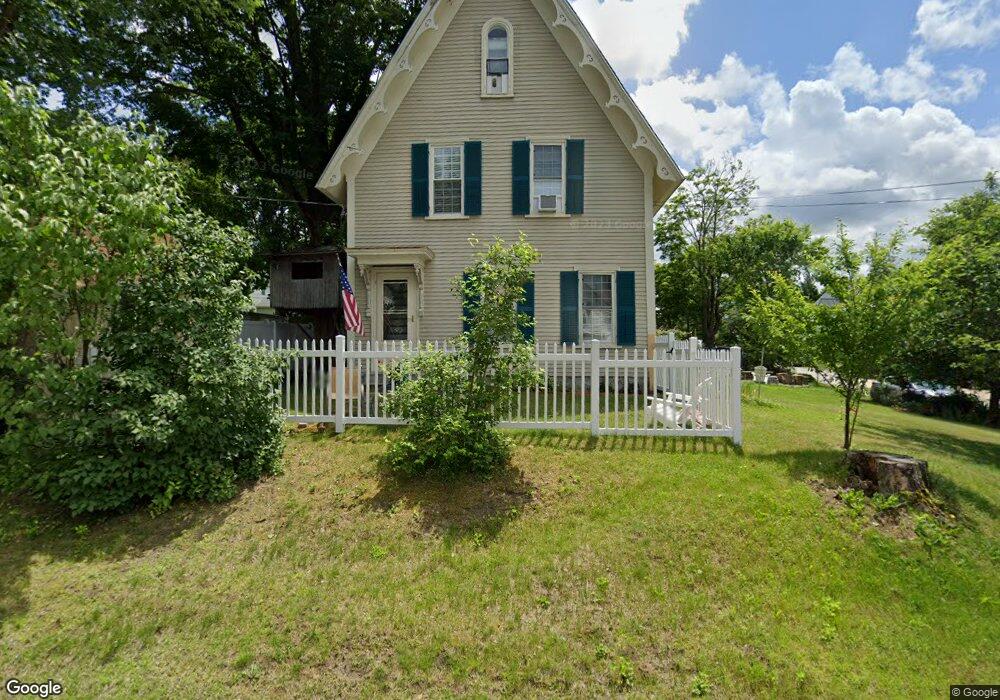
35 Oak St Franklin, NH 03235
Estimated Value: $377,000 - $421,756
4
Beds
3
Baths
2,379
Sq Ft
$167/Sq Ft
Est. Value
About This Home
This home is located at 35 Oak St, Franklin, NH 03235 and is currently estimated at $398,439, approximately $167 per square foot. 35 Oak St is a home located in Merrimack County with nearby schools including Paul A. Smith School, Franklin Middle School, and Franklin High School.
Ownership History
Date
Name
Owned For
Owner Type
Purchase Details
Closed on
Aug 20, 2003
Sold by
Mercaldi Robert M and Mercaldi Janice L
Bought by
Gilman Lora and Gilman Richard
Current Estimated Value
Home Financials for this Owner
Home Financials are based on the most recent Mortgage that was taken out on this home.
Original Mortgage
$142,320
Outstanding Balance
$62,215
Interest Rate
5.52%
Estimated Equity
$336,224
Purchase Details
Closed on
Jul 3, 2001
Sold by
Vonhof Michael G and Vonhof Rachel L
Bought by
Mercaldi Robert M and Mercaldi Janice L
Home Financials for this Owner
Home Financials are based on the most recent Mortgage that was taken out on this home.
Original Mortgage
$84,900
Interest Rate
7.14%
Purchase Details
Closed on
May 1, 2000
Sold by
Johnston Donald R
Bought by
Vonhof Michael G and Vonhof Rachel L
Home Financials for this Owner
Home Financials are based on the most recent Mortgage that was taken out on this home.
Original Mortgage
$72,000
Interest Rate
8.23%
Create a Home Valuation Report for This Property
The Home Valuation Report is an in-depth analysis detailing your home's value as well as a comparison with similar homes in the area
Home Values in the Area
Average Home Value in this Area
Purchase History
| Date | Buyer | Sale Price | Title Company |
|---|---|---|---|
| Gilman Lora | $177,900 | -- | |
| Mercaldi Robert M | $99,900 | -- | |
| Vonhof Michael G | $80,000 | -- |
Source: Public Records
Mortgage History
| Date | Status | Borrower | Loan Amount |
|---|---|---|---|
| Open | Vonhof Michael G | $142,320 | |
| Previous Owner | Vonhof Michael G | $84,900 | |
| Previous Owner | Vonhof Michael G | $72,000 |
Source: Public Records
Tax History Compared to Growth
Tax History
| Year | Tax Paid | Tax Assessment Tax Assessment Total Assessment is a certain percentage of the fair market value that is determined by local assessors to be the total taxable value of land and additions on the property. | Land | Improvement |
|---|---|---|---|---|
| 2024 | $5,119 | $298,500 | $71,200 | $227,300 |
| 2023 | $4,854 | $298,500 | $71,200 | $227,300 |
| 2022 | $4,488 | $184,000 | $57,600 | $126,400 |
| 2021 | $4,271 | $184,000 | $57,600 | $126,400 |
| 2020 | $4,203 | $184,000 | $57,600 | $126,400 |
| 2019 | $4,134 | $184,000 | $57,600 | $126,400 |
| 2018 | $4,041 | $184,000 | $57,600 | $126,400 |
| 2017 | $3,642 | $142,500 | $26,600 | $115,900 |
| 2016 | $3,595 | $142,500 | $26,600 | $115,900 |
| 2015 | $2,770 | $111,020 | $18,620 | $92,400 |
| 2011 | $4,048 | $188,100 | $30,600 | $157,500 |
Source: Public Records
Map
Nearby Homes
- 99 Pleasant St
- 88 Franklin St
- 416 Central St
- 152 Prospect St
- 75 School St
- 123 Franklin St
- 624 Central St
- 28 Leach Ave
- 28 Maple Square
- 135 Franklin St
- 46 Sanborn St
- 82-84 Woodridge Rd
- 721 Central St
- 24 Munroe St Unit 2
- 24 Munroe St Unit 1&2
- 24 Munroe St Unit 1
- 0 Rowell Dr Unit 406 5043422
- 180 Kendall St
- 193 Kendall St
- Lot 4 Piper St