J
Seller's Agent in 2023
Janet Manni
RE/MAX
(732) 208-6399
19 in this area
41 Total Sales
Estimated Value: $1,164,458 - $1,294,000
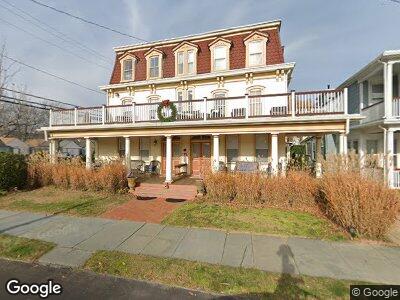
WINTER RENTAL. Come and enjoy this adorable 1 bedroom apartment with Ocean views!! It's features include location, location, location - just over a block to the beachfront and boardwalk, beautiful sunny rooms with high ceilings and oversized windows, wood floors and tons of charm. Tastefully furnished with a queen sized bed. Utilities, Wifi and a smart TV are included! Available 10/01/23-5/15/24. 1.5 months security, $150 cleaning fee. No smoking, no pets.
| Date | Buyer | Sale Price | Title Company |
|---|---|---|---|
| Margolis Robin | $143,000 | -- |
| Date | Status | Borrower | Loan Amount |
|---|---|---|---|
| Open | Schubel Brian | $375,000 | |
| Closed | Hekker John M | $210,000 | |
| Closed | Margolis Robin | $10,000 | |
| Closed | Margolis Robin | $90,000 | |
| Closed | Margolis Robin | $116,000 |
| Date | Event | Price | Change | Sq Ft Price |
|---|---|---|---|---|
| 10/03/2023 10/03/23 | Rented | $12,375 | +627.9% | -- |
| 09/29/2023 09/29/23 | Under Contract | -- | -- | -- |
| 08/12/2023 08/12/23 | For Rent | $1,700 | -69.6% | -- |
| 03/10/2022 03/10/22 | Rented | $5,600 | +239.4% | -- |
| 02/02/2022 02/02/22 | For Rent | $1,650 | -87.1% | -- |
| 01/31/2022 01/31/22 | Rented | $12,800 | +700.0% | -- |
| 09/01/2021 09/01/21 | Under Contract | -- | -- | -- |
| 08/09/2021 08/09/21 | For Rent | $1,600 | -42.9% | -- |
| 03/18/2021 03/18/21 | Rented | $2,800 | +100.0% | -- |
| 02/20/2021 02/20/21 | Under Contract | -- | -- | -- |
| 02/07/2021 02/07/21 | For Rent | $1,400 | -- | -- |
| Year | Tax Paid | Tax Assessment Tax Assessment Total Assessment is a certain percentage of the fair market value that is determined by local assessors to be the total taxable value of land and additions on the property. | Land | Improvement |
|---|---|---|---|---|
| 2024 | $17,139 | $1,057,900 | $556,800 | $501,100 |
| 2023 | $17,139 | $966,100 | $586,300 | $379,800 |
| 2022 | $16,444 | $811,700 | $435,800 | $375,900 |
| 2021 | $11,689 | $791,700 | $568,500 | $223,200 |
| 2020 | $15,617 | $749,000 | $495,900 | $253,100 |
| 2019 | $11,689 | $553,200 | $358,800 | $194,400 |
| 2018 | $11,779 | $551,700 | $358,800 | $192,900 |
| 2017 | $11,963 | $537,400 | $358,800 | $178,600 |
| 2016 | $11,919 | $534,500 | $358,800 | $175,700 |
| 2015 | $12,796 | $584,300 | $398,700 | $185,600 |
| 2014 | $10,444 | $391,900 | $273,700 | $118,200 |
J
Seller's Agent in 2023
Janet Manni
RE/MAX
(732) 208-6399
19 in this area
41 Total Sales
