J
Seller's Agent in 2024
Janet Manni
RE/MAX
(732) 208-6399
19 in this area
41 Total Sales
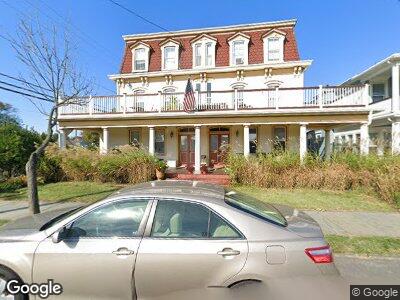
This rare annual rental is located on Ocean Grove's premiere street, just 2 blocks to the beach with ocean views! It's adorable and features a sunny living room open to the kitchen with a large pantry closet, a bedroom, large updated bath and built-in a/c units. The tenant also has use of the front porch! All utilities included!! See it today!! No smoking, vaping or pets.
| Date | Buyer | Sale Price | Title Company |
|---|---|---|---|
| Margolis Robin | $143,000 | -- |
| Date | Status | Borrower | Loan Amount |
|---|---|---|---|
| Open | Schubel Brian | $375,000 | |
| Closed | Hekker John M | $210,000 | |
| Closed | Margolis Robin | $10,000 | |
| Closed | Margolis Robin | $90,000 | |
| Closed | Margolis Robin | $116,000 |
| Date | Event | Price | Change | Sq Ft Price |
|---|---|---|---|---|
| 11/10/2024 11/10/24 | Rented | $21,600 | +1100.0% | -- |
| 10/23/2024 10/23/24 | Under Contract | -- | -- | -- |
| 10/21/2024 10/21/24 | Price Changed | $1,800 | -2.7% | $1 / Sq Ft |
| 10/13/2024 10/13/24 | Price Changed | $1,850 | -2.6% | $1 / Sq Ft |
| 09/21/2024 09/21/24 | Price Changed | $1,900 | -2.6% | $1 / Sq Ft |
| 08/22/2024 08/22/24 | Price Changed | $1,950 | -2.5% | $1 / Sq Ft |
| 07/19/2024 07/19/24 | For Rent | $2,000 | -91.0% | -- |
| 07/26/2022 07/26/22 | Rented | $22,200 | +1100.0% | -- |
| 07/01/2022 07/01/22 | Under Contract | -- | -- | -- |
| 06/10/2022 06/10/22 | For Rent | $1,850 | -- | -- |
| Year | Tax Paid | Tax Assessment Tax Assessment Total Assessment is a certain percentage of the fair market value that is determined by local assessors to be the total taxable value of land and additions on the property. | Land | Improvement |
|---|---|---|---|---|
| 2024 | $17,139 | $1,057,900 | $556,800 | $501,100 |
| 2023 | $17,139 | $966,100 | $586,300 | $379,800 |
| 2022 | $16,444 | $811,700 | $435,800 | $375,900 |
| 2021 | $11,689 | $791,700 | $568,500 | $223,200 |
| 2020 | $15,617 | $749,000 | $495,900 | $253,100 |
| 2019 | $11,689 | $553,200 | $358,800 | $194,400 |
| 2018 | $11,779 | $551,700 | $358,800 | $192,900 |
| 2017 | $11,963 | $537,400 | $358,800 | $178,600 |
| 2016 | $11,919 | $534,500 | $358,800 | $175,700 |
| 2015 | $12,796 | $584,300 | $398,700 | $185,600 |
| 2014 | $10,444 | $391,900 | $273,700 | $118,200 |
J
Seller's Agent in 2024
Janet Manni
RE/MAX
(732) 208-6399
19 in this area
41 Total Sales

Buyer's Agent in 2024
Michele DeRose
RE/MAX
(732) 682-6483
15 in this area
24 Total Sales