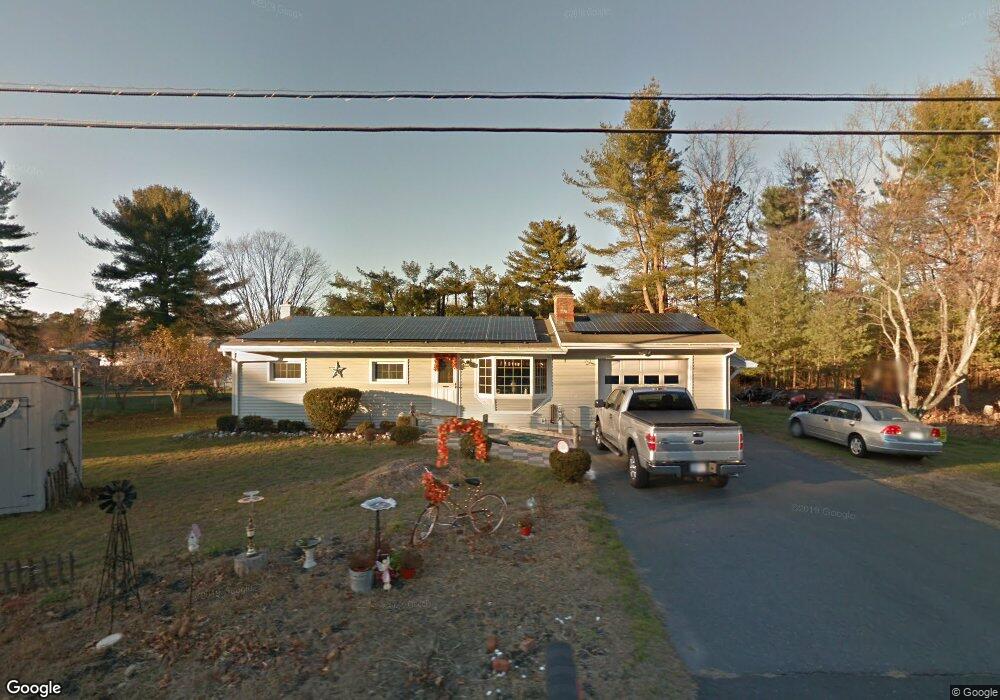
35 Pomeroy St Easthampton, MA 01027
Estimated Value: $304,000 - $367,000
3
Beds
2
Baths
864
Sq Ft
$381/Sq Ft
Est. Value
About This Home
This home is located at 35 Pomeroy St, Easthampton, MA 01027 and is currently estimated at $329,342, approximately $381 per square foot. 35 Pomeroy St is a home located in Hampshire County with nearby schools including Easthampton High School, Calvary Baptist Christian School, and Westfield Christian Academy.
Ownership History
Date
Name
Owned For
Owner Type
Purchase Details
Closed on
Jul 12, 2021
Sold by
Ducharme Daniel J
Bought by
Daniel J Ducharame Ret
Current Estimated Value
Purchase Details
Closed on
Jun 28, 1990
Sold by
Ellison Douglas J
Bought by
Strojny Timohty J
Create a Home Valuation Report for This Property
The Home Valuation Report is an in-depth analysis detailing your home's value as well as a comparison with similar homes in the area
Home Values in the Area
Average Home Value in this Area
Purchase History
| Date | Buyer | Sale Price | Title Company |
|---|---|---|---|
| Daniel J Ducharame Ret | -- | None Available | |
| Strojny Timohty J | $89,000 | -- |
Source: Public Records
Mortgage History
| Date | Status | Borrower | Loan Amount |
|---|---|---|---|
| Previous Owner | Strojny Timohty J | $97,800 | |
| Previous Owner | Strojny Timohty J | $25,000 | |
| Previous Owner | Strojny Timohty J | $9,000 | |
| Previous Owner | Strojny Timohty J | $21,000 |
Source: Public Records
Tax History
| Year | Tax Paid | Tax Assessment Tax Assessment Total Assessment is a certain percentage of the fair market value that is determined by local assessors to be the total taxable value of land and additions on the property. | Land | Improvement |
|---|---|---|---|---|
| 2025 | $4,138 | $302,700 | $107,900 | $194,800 |
| 2024 | $3,995 | $294,600 | $104,700 | $189,900 |
| 2023 | $3,056 | $208,600 | $82,500 | $126,100 |
| 2022 | $3,448 | $208,600 | $82,500 | $126,100 |
| 2021 | $3,766 | $214,700 | $82,500 | $132,200 |
| 2020 | $3,705 | $208,600 | $82,500 | $126,100 |
| 2019 | $3,111 | $201,200 | $82,500 | $118,700 |
| 2018 | $2,987 | $186,700 | $77,800 | $108,900 |
| 2017 | $2,918 | $180,000 | $74,800 | $105,200 |
| 2016 | $2,479 | $159,000 | $74,800 | $84,200 |
| 2015 | $2,409 | $159,000 | $74,800 | $84,200 |
Source: Public Records
Map
Nearby Homes
Your Personal Tour Guide
Ask me questions while you tour the home.