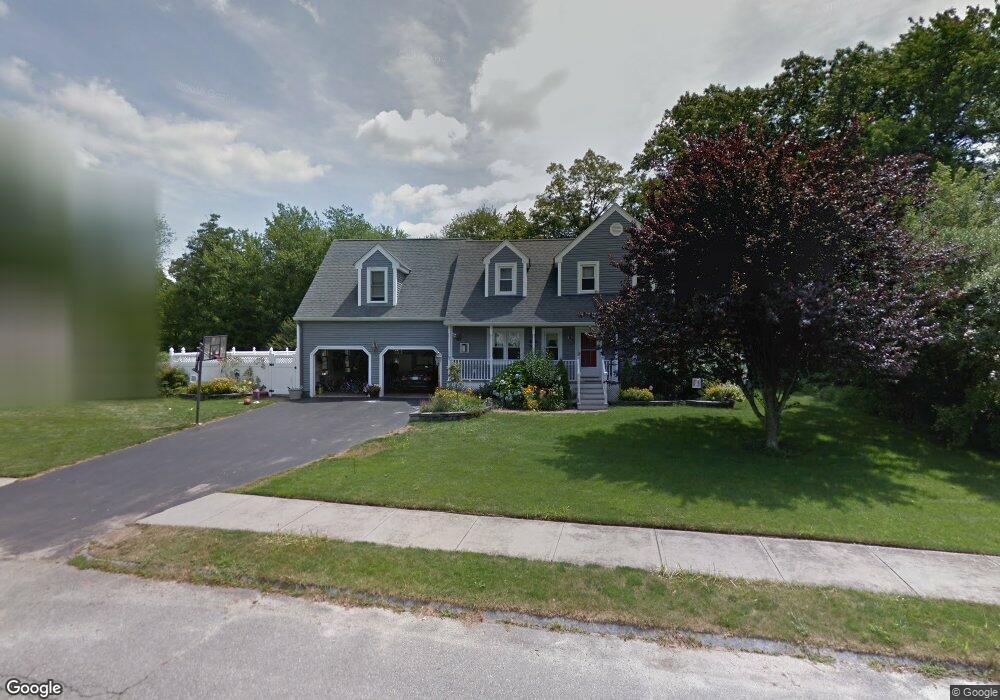
35 Rayburn Dr Millbury, MA 01527
Estimated Value: $614,000 - $692,000
4
Beds
4
Baths
2,008
Sq Ft
$329/Sq Ft
Est. Value
About This Home
This home is located at 35 Rayburn Dr, Millbury, MA 01527 and is currently estimated at $661,435, approximately $329 per square foot. 35 Rayburn Dr is a home located in Worcester County with nearby schools including Elmwood Street Elementary School, Raymond E. Shaw Elementary School, and Millbury Junior/Senior High School.
Ownership History
Date
Name
Owned For
Owner Type
Purchase Details
Closed on
Oct 26, 2018
Sold by
Reumann Kimberly A and Reumann William R
Bought by
Reumann Kimberly A and Reumann Sylvia Alfred
Current Estimated Value
Purchase Details
Closed on
Sep 28, 1995
Sold by
Pasquale Steven and Pasquale Julie
Bought by
Rueman William R and Ruemann Kimberly
Purchase Details
Closed on
May 1, 1991
Sold by
Quality Home Bldrs Inc
Bought by
Pasquale Steven M and Bowers Julie S
Create a Home Valuation Report for This Property
The Home Valuation Report is an in-depth analysis detailing your home's value as well as a comparison with similar homes in the area
Home Values in the Area
Average Home Value in this Area
Purchase History
| Date | Buyer | Sale Price | Title Company |
|---|---|---|---|
| Reumann Kimberly A | -- | -- | |
| Reumann Kimberly A | -- | -- | |
| Rueman William R | $144,500 | -- | |
| Rueman William R | $144,500 | -- | |
| Pasquale Steven M | $137,500 | -- | |
| Pasquale Steven M | $137,500 | -- |
Source: Public Records
Mortgage History
| Date | Status | Borrower | Loan Amount |
|---|---|---|---|
| Previous Owner | Pasquale Steven M | $131,500 | |
| Previous Owner | Pasquale Steven M | $54,500 | |
| Previous Owner | Pasquale Steven M | $25,000 |
Source: Public Records
Tax History Compared to Growth
Tax History
| Year | Tax Paid | Tax Assessment Tax Assessment Total Assessment is a certain percentage of the fair market value that is determined by local assessors to be the total taxable value of land and additions on the property. | Land | Improvement |
|---|---|---|---|---|
| 2025 | $8,192 | $611,800 | $142,500 | $469,300 |
| 2024 | $7,525 | $568,800 | $132,000 | $436,800 |
| 2023 | $6,796 | $470,300 | $88,900 | $381,400 |
| 2022 | $6,068 | $404,500 | $88,900 | $315,600 |
| 2021 | $6,594 | $388,500 | $88,900 | $299,600 |
| 2020 | $13,563 | $383,200 | $88,900 | $294,300 |
| 2019 | $6,668 | $370,100 | $77,400 | $292,700 |
| 2018 | $4,430 | $369,700 | $90,900 | $278,800 |
| 2017 | $5,731 | $348,800 | $90,900 | $257,900 |
| 2016 | $5,588 | $339,500 | $90,900 | $248,600 |
| 2015 | $5,491 | $333,600 | $96,500 | $237,100 |
| 2014 | $5,050 | $295,300 | $93,000 | $202,300 |
Source: Public Records
Map
Nearby Homes