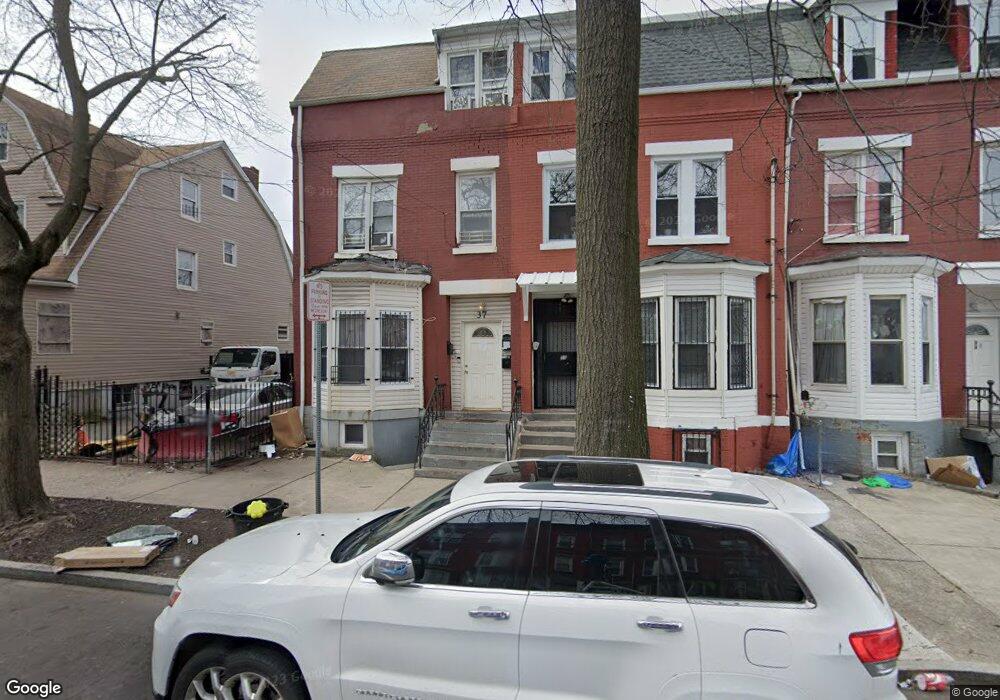
35 S 12th St Newark, NJ 07107
Fairmount NeighborhoodEstimated Value: $322,000 - $442,000
--
Bed
--
Bath
2,216
Sq Ft
$168/Sq Ft
Est. Value
About This Home
This home is located at 35 S 12th St, Newark, NJ 07107 and is currently estimated at $372,738, approximately $168 per square foot. 35 S 12th St is a home located in Essex County with nearby schools including Harriet Tubman School, Sir Isaac Newton Elementary School, and Camden Street Elementary School.
Ownership History
Date
Name
Owned For
Owner Type
Purchase Details
Closed on
Apr 10, 2006
Sold by
Foglia Roland
Bought by
Pineda Julia
Current Estimated Value
Home Financials for this Owner
Home Financials are based on the most recent Mortgage that was taken out on this home.
Original Mortgage
$152,000
Outstanding Balance
$87,400
Interest Rate
6.37%
Estimated Equity
$285,338
Purchase Details
Closed on
Oct 9, 1996
Sold by
Alaska Seaboard
Bought by
Foglia Roland
Purchase Details
Closed on
Sep 8, 1995
Sold by
Ge Capital
Bought by
Alaska Seabroad
Purchase Details
Closed on
May 2, 1989
Sold by
Bald Eagle Holding Corp
Bought by
Paytas Joseph
Create a Home Valuation Report for This Property
The Home Valuation Report is an in-depth analysis detailing your home's value as well as a comparison with similar homes in the area
Home Values in the Area
Average Home Value in this Area
Purchase History
| Date | Buyer | Sale Price | Title Company |
|---|---|---|---|
| Pineda Julia | $170,000 | -- | |
| Foglia Roland | $13,000 | -- | |
| Alaska Seabroad | $9,101 | -- | |
| Paytas Joseph | $100,000 | -- |
Source: Public Records
Mortgage History
| Date | Status | Borrower | Loan Amount |
|---|---|---|---|
| Open | Pineda Julia | $152,000 |
Source: Public Records
Tax History Compared to Growth
Tax History
| Year | Tax Paid | Tax Assessment Tax Assessment Total Assessment is a certain percentage of the fair market value that is determined by local assessors to be the total taxable value of land and additions on the property. | Land | Improvement |
|---|---|---|---|---|
| 2025 | $3,672 | $98,500 | $19,500 | $79,000 |
| 2024 | $3,672 | $98,500 | $19,500 | $79,000 |
| 2022 | $3,680 | $98,500 | $19,500 | $79,000 |
| 2021 | $3,678 | $98,500 | $19,500 | $79,000 |
| 2020 | $3,743 | $98,500 | $19,500 | $79,000 |
| 2019 | $3,705 | $98,500 | $19,500 | $79,000 |
| 2018 | $3,638 | $98,500 | $19,500 | $79,000 |
| 2017 | $3,507 | $98,500 | $19,500 | $79,000 |
| 2016 | $3,388 | $98,500 | $19,500 | $79,000 |
| 2015 | $3,259 | $98,500 | $19,500 | $79,000 |
| 2014 | $3,054 | $98,500 | $19,500 | $79,000 |
Source: Public Records
Map
Nearby Homes