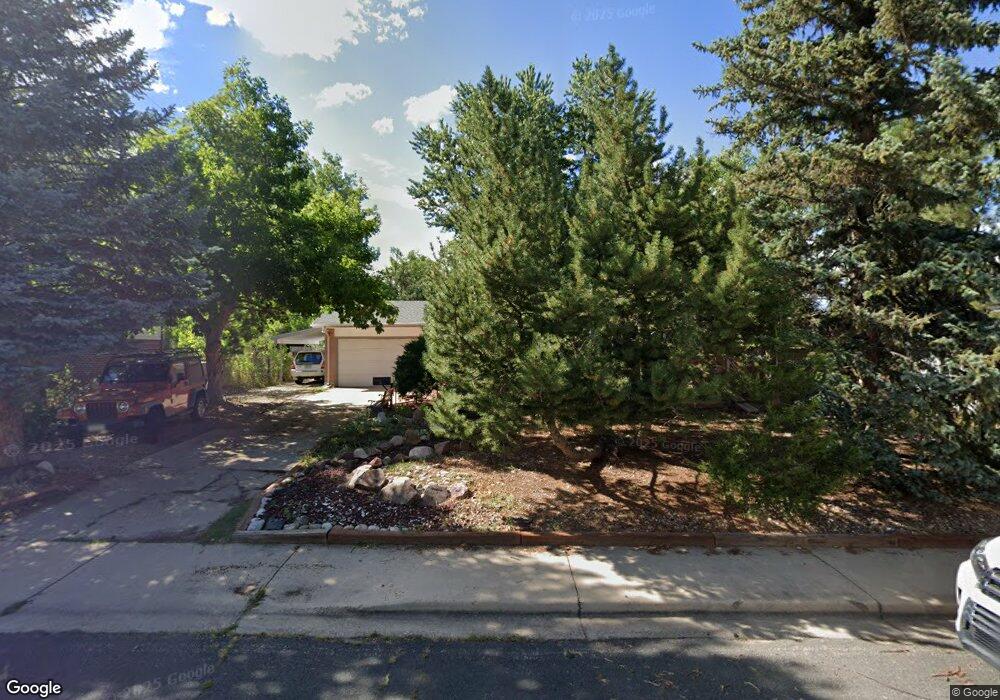
35 S 35th St Boulder, CO 80305
South Boulder NeighborhoodEstimated Value: $782,833 - $870,000
3
Beds
2
Baths
1,204
Sq Ft
$687/Sq Ft
Est. Value
About This Home
This home is located at 35 S 35th St, Boulder, CO 80305 and is currently estimated at $827,208, approximately $687 per square foot. 35 S 35th St is a home located in Boulder County with nearby schools including Creekside Elementary School, Manhattan Middle School of the Arts & Academics, and Fairview High School.
Ownership History
Date
Name
Owned For
Owner Type
Purchase Details
Closed on
Dec 4, 2008
Sold by
Morrison Michael Lawrence
Bought by
Morrison Michael Lawrence and Jacobs Tracy M
Current Estimated Value
Purchase Details
Closed on
Apr 26, 1996
Sold by
Morrison Pamela Karen
Bought by
Morrison Michael Lawrence
Home Financials for this Owner
Home Financials are based on the most recent Mortgage that was taken out on this home.
Original Mortgage
$148,000
Outstanding Balance
$68,689
Interest Rate
4.95%
Estimated Equity
$758,519
Purchase Details
Closed on
Jan 29, 1991
Bought by
Morrison Michael Lawrence
Purchase Details
Closed on
Aug 28, 1985
Bought by
Morrison Michael Lawrence
Purchase Details
Closed on
Jul 22, 1980
Bought by
Morrison Michael Lawrence
Create a Home Valuation Report for This Property
The Home Valuation Report is an in-depth analysis detailing your home's value as well as a comparison with similar homes in the area
Home Values in the Area
Average Home Value in this Area
Purchase History
| Date | Buyer | Sale Price | Title Company |
|---|---|---|---|
| Morrison Michael Lawrence | -- | None Available | |
| Morrison Michael Lawrence | -- | Land Title | |
| Morrison Michael Lawrence | $94,200 | -- | |
| Morrison Michael Lawrence | $90,400 | -- | |
| Morrison Michael Lawrence | -- | -- |
Source: Public Records
Mortgage History
| Date | Status | Borrower | Loan Amount |
|---|---|---|---|
| Open | Morrison Michael Lawrence | $148,000 |
Source: Public Records
Tax History
| Year | Tax Paid | Tax Assessment Tax Assessment Total Assessment is a certain percentage of the fair market value that is determined by local assessors to be the total taxable value of land and additions on the property. | Land | Improvement |
|---|---|---|---|---|
| 2025 | $4,133 | $51,044 | $36,381 | $14,663 |
| 2024 | $4,133 | $51,044 | $36,381 | $14,663 |
| 2023 | $4,061 | $53,727 | $41,982 | $15,430 |
| 2022 | $3,550 | $45,182 | $31,296 | $13,886 |
| 2021 | $3,386 | $46,482 | $32,196 | $14,286 |
| 2020 | $3,970 | $45,603 | $26,527 | $19,076 |
| 2019 | $3,909 | $45,603 | $26,527 | $19,076 |
| 2018 | $3,644 | $42,034 | $24,408 | $17,626 |
| 2017 | $3,530 | $46,470 | $26,984 | $19,486 |
| 2016 | $3,261 | $37,674 | $17,034 | $20,640 |
| 2015 | $3,088 | $30,646 | $15,681 | $14,965 |
| 2014 | $2,577 | $30,646 | $15,681 | $14,965 |
Source: Public Records
Map
Nearby Homes
- 3805 Martin Dr
- 210 S 39th St
- 345 S 38th St
- 3000 Dartmouth Ave
- 780 33rd St
- 770 36th St
- 450 S 41st St
- 2955 Stanford Ave
- 805 29th St Unit 253
- 805 29th St Unit 157
- 805 29th St Unit 402
- 805 29th St Unit 404
- 4453 Hamilton Ct
- 4595 Moorhead Ave
- 905 36th St
- 2585 Kohler Dr
- 2850 Aurora Ave Unit 107
- 2250 Bluebell Ave
- 4521 Navajo Place
- 4415 Laguna Place Unit 201
Your Personal Tour Guide
Ask me questions while you tour the home.